Home
ArcIn AI
Login Request Demo Free Trial →
14 companiesstarted a trial this week
|
3 onboarding slots available this month — Reserve yours →
Applicare

Know What Broke.
Know Why.
Fix It Faster.

Applicare gives your teams unified visibility across applications, Kubernetes, cloud infrastructure, databases, logs, metrics and traces—with AI-powered root-cause analysis and automated remediation.

Start Free Trial → See Applicare in Action

No credit card required

Applicare — Production Intelligence⬤ Live
MTTR this week
11 min
↓ from 4.5 hrs
On-call pages
4
↓ 80% vs last month
Deploy #6205
Regression
checkout-svc · p99 +340ms
IntelliTune
Auto-fixed
380ms · 0 pages fired
ArcIn: DB pool exhaustion (498/500) traced to N+1 in OrderRepository. Checkout latency +340ms → resolved in 380ms. No incident. No pages.

"My team stopped dreading Monday."

— VP Engineering, AeroMexico

11 min
MTTR — down from 4.5 hrs
80%
On-call page reduction avg
1B+
Events/day — zero sampling
400ms
IntelliTune median remediation
See Applicare in Action

Your entire environment.
One intelligent view.

See how Applicare detects an issue, connects the signals, identifies the likely root cause, and helps your team fix it faster.

Applicare — checkout-svc · production⬤ Live
Application health
42 / 42
Services healthy
Kubernetes health
18 pods
3 nodes · 0 restarts
Infrastructure
CPU 34%
Memory 58%
Alerts
2 active
1 critical · 1 warning
Database
p95 210ms
Pool usage ↑ 96%
Dependencies
24 services
Entity graph · live
Logs
WARN checkout-svc: pool wait 480ms
WARN checkout-svc: pool wait 512ms
Traces
1.2M
Spans / min
ArcIn Elevated DB connection-pool usage on checkout-svc detected 40 minutes before checkout latency crossed SLO.
Applicare auto-instrumenting a Kubernetes workload Watch a 90-second product walkthroughLive Kubernetes auto-instrumentation, start to finish 1:30
Example incidentCheckout service became slow
Detected
Checkout response time suddenly increased.
Investigating
Applicare correlates application metrics, traces, infrastructure data and database activity.
Root cause
Database connection pool exhaustion is identified as the likely cause.
Action
Applicare recommends the appropriate remediation.
Resolved
The issue is fixed and the service returns to normal.
Detect Understand Fix
Detect
Find problems before they become bigger incidents.
Understand
Connect the signals and identify the likely cause.
Fix
Recommend or automate the appropriate response.

Want to see it with your environment?

Start Free Trial →
AeroMexico·Leading Private Bank·NTT DATA·Mediclinic·Danube Group·ONP·UAE Conglomerate·ATN·Abril·Seygen·MD India Online·AeroMexico·Leading Private Bank·NTT DATA·Mediclinic·Danube Group·ONP·UAE Conglomerate·ATN·Abril·Seygen·MD India Online·

AI Engines

Four engines. One platform.
Zero blind spots.

Engine 01
🕸

Entity Graph

Causal topology of your entire stack

You get a living map of your entire stack — auto-discovered, always current, no manual CMDB. Every dependency visible before your next incident.

340 entities · <12s rebuild
Engine 02

IntelliTune

Self-healing within policy gates

Your on-call team stops getting woken up. 80% of incidents are resolved automatically in 400ms — before PagerDuty even fires. 200+ patterns, fully within your policy gates.

400ms · 200+ patterns · 80% ↓ pages
Engine 03
👁

IntelliSense

Anomaly detection — zero alert rules

You get anomaly detection that learns your environment — no alert rules to write, no thresholds to tune. Zero-day attacks and config drift caught before they become incidents.

Zero alert rules · zero-day · real time
Engine 04
🔍

IntelliTrace

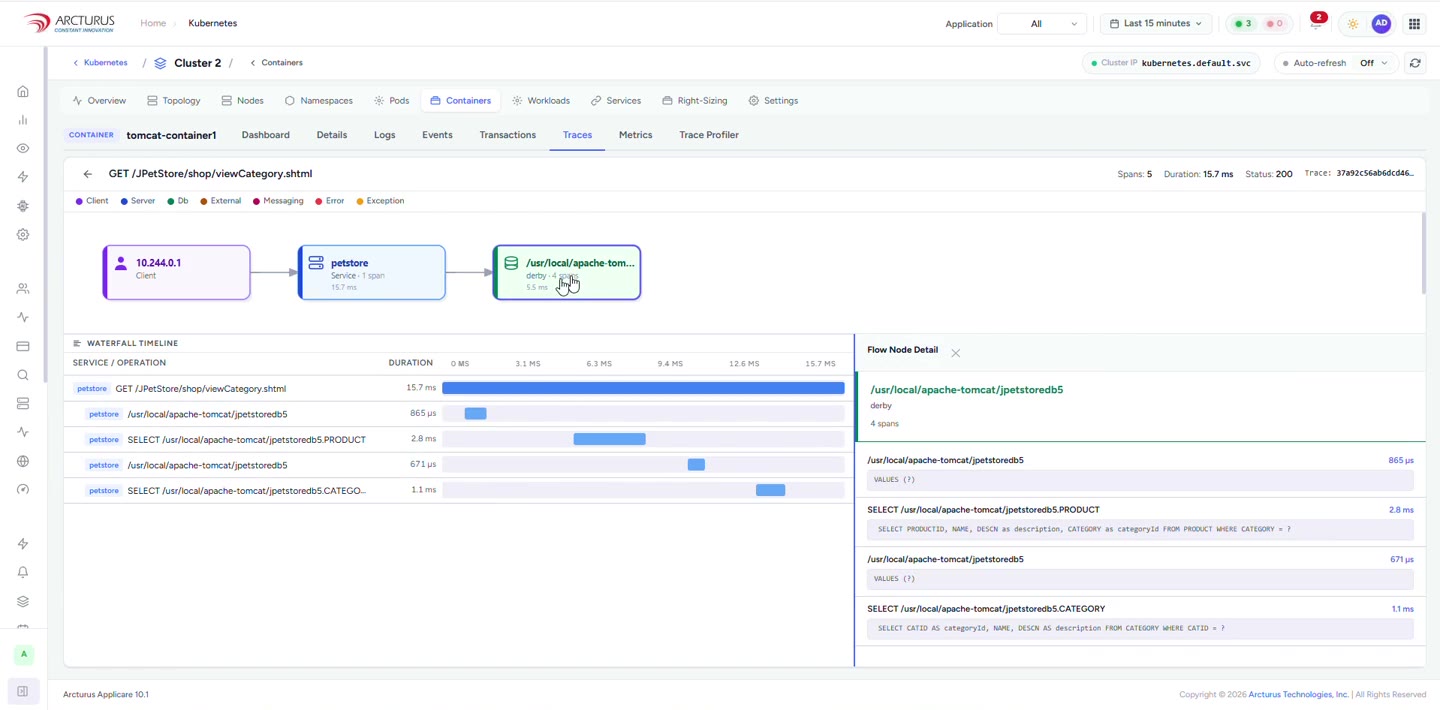
End-to-end transaction tracing

Follow every transaction across every tier — JVM, middleware, database, API. Root cause pinpointed in seconds, not hours. No sampling. Full fidelity, always on.

Full fidelity · cross-tier · <5s root cause
Solutions

Every stack.
Fully monitored.

AWS, Azure, GCP, Kubernetes, SAP, ServiceNow, VMware — all correlated in one causal entity graph.

View all solutions →
Customers

enterprise teams.
Real results.

AeroMexico
Airlines · Mexico
4.5h → 11min
MTTR reduction
Leading Private Bank
Financial Services
3.2h → 18min
MTTR first month
Mediclinic
Healthcare · UAE
11wk → 18 days
Audit prep time
NTT Data
Technology · Global
80%
On-call page reduction
Read customer stories →
Get started

Deploy today.
See everything tomorrow.

One agent. Full coverage. ArcIn starts identifying issues within the first hour.

Only 3 onboarding slots available this month — teams currently in queueFilling fast
For Engineers
14-Day Free Trial
Full platform. Every engine. Zero limits. No credit card.
  • All four engines from day one
  • ArcIn AI — unlimited queries
  • IntelliTune — 200+ patterns
  • Dedicated onboarding engineer
Start free trial →
For Engineering Leaders
30-Minute Live Demo
Entity graph on your real environment. ArcIn on a live incident.
  • Live demo on your real stack
  • Custom MTTR estimate for your team
  • One follow-up email. That's it.
Book demo →
90-Day MTTR Guarantee
50% MTTR reduction in 90 days or full refund. No questions, no conditions, no lawyers.