
Aspects of Kubernetes Monitoring
Log Monitoring
Health and Performance
Resource Usage
Collecting and analyzing logs, events from pods, and nodes to troubleshoot problems and gain awareness into application behavior.
Monitoring the overall health of the Kubernetes cluster, including control plane components (API server, scheduler, controller manager) and worker nodes, while ensuring autoscaling mechanisms function effectively to scale applications based on demand.
Tracking CPU, memory, storage, and network usage across nodes and pods to ensure resources are allocated efficiently and to detect any potential bottlenecks.
Applicare Kubernetes Monitoring

Viewing Kubernetes Cluster IP Details
To view the details of your Kubernetes cluster, start by navigating to the Kubernetes section in the left-hand menu. Once there, locate and click on the Cluster IP option. This will display all the relevant information about the cluster’s IP, allowing you to monitor and manage your Kubernetes setup more effectively. Ensure that you have the necessary permissions to access this data and make any required adjustments to your configuration.
Key Metrics for Application Performance Monitoring
-
Application Performance
-
Response Time: Measure the time taken for requests to be processed.
-
Throughput: Track the number of transactions processed per second.
-
Error Rates: Monitor the rate of exceptions and errors to identify application issues.


Kubernetes Cluster Overview and Configuration Insights
Here, you can view comprehensive Kubernetes Cluster Details, including access to services, nodes, namespaces, and routes. You’ll also find detailed configurations and insights into the specific components and their interactions within the cluster.
The Breakdown

Nodes
-
CPU Used - Total CPU utilization for individual node in the cluster.
-
Memory Used - Total memory utilization for individual node in the cluster.
Namespaces
-
Click on the Name column to access the namespace details.
-
View the details of the namespace by selecting the Name column.
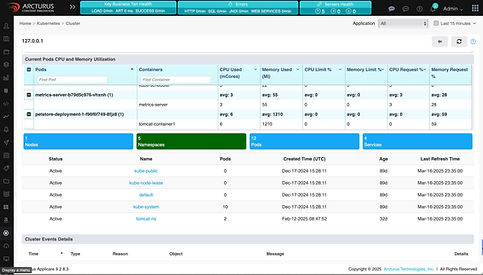
Pods
-
CPU Used - Total CPU utilization of all the containers in the pods (milicores).
-
Memory Used - Total memory utilization of all the containers in the pods (mebibytes)
-
Other CPU and Memory Sections
Services
-
Click on the Name column to access the service details.
-
View the service details by selecting the Name column.
