HomePlatformSolutionsResourcesCustomers
The Applicare Platform

One graph.
Every answer.

Applicare is built on a causal entity graph — continuously updated from every signal in your stack — with four AI engines that detect, explain, and resolve incidents automatically.

Live — Network Topology & Entity Graph
<12s
Entity graph rebuilt after change
400ms
IntelliTune median remediation
1B+
Events/day — zero sampling
80%
On-call page reduction avg
Network topology auto-discovery — zero manual configuration
Applicare 10.0 — Live
Network Topology — auto-discovered hosts map, 8 hosts, Gateways, Discoverers and Agents with IP mapping

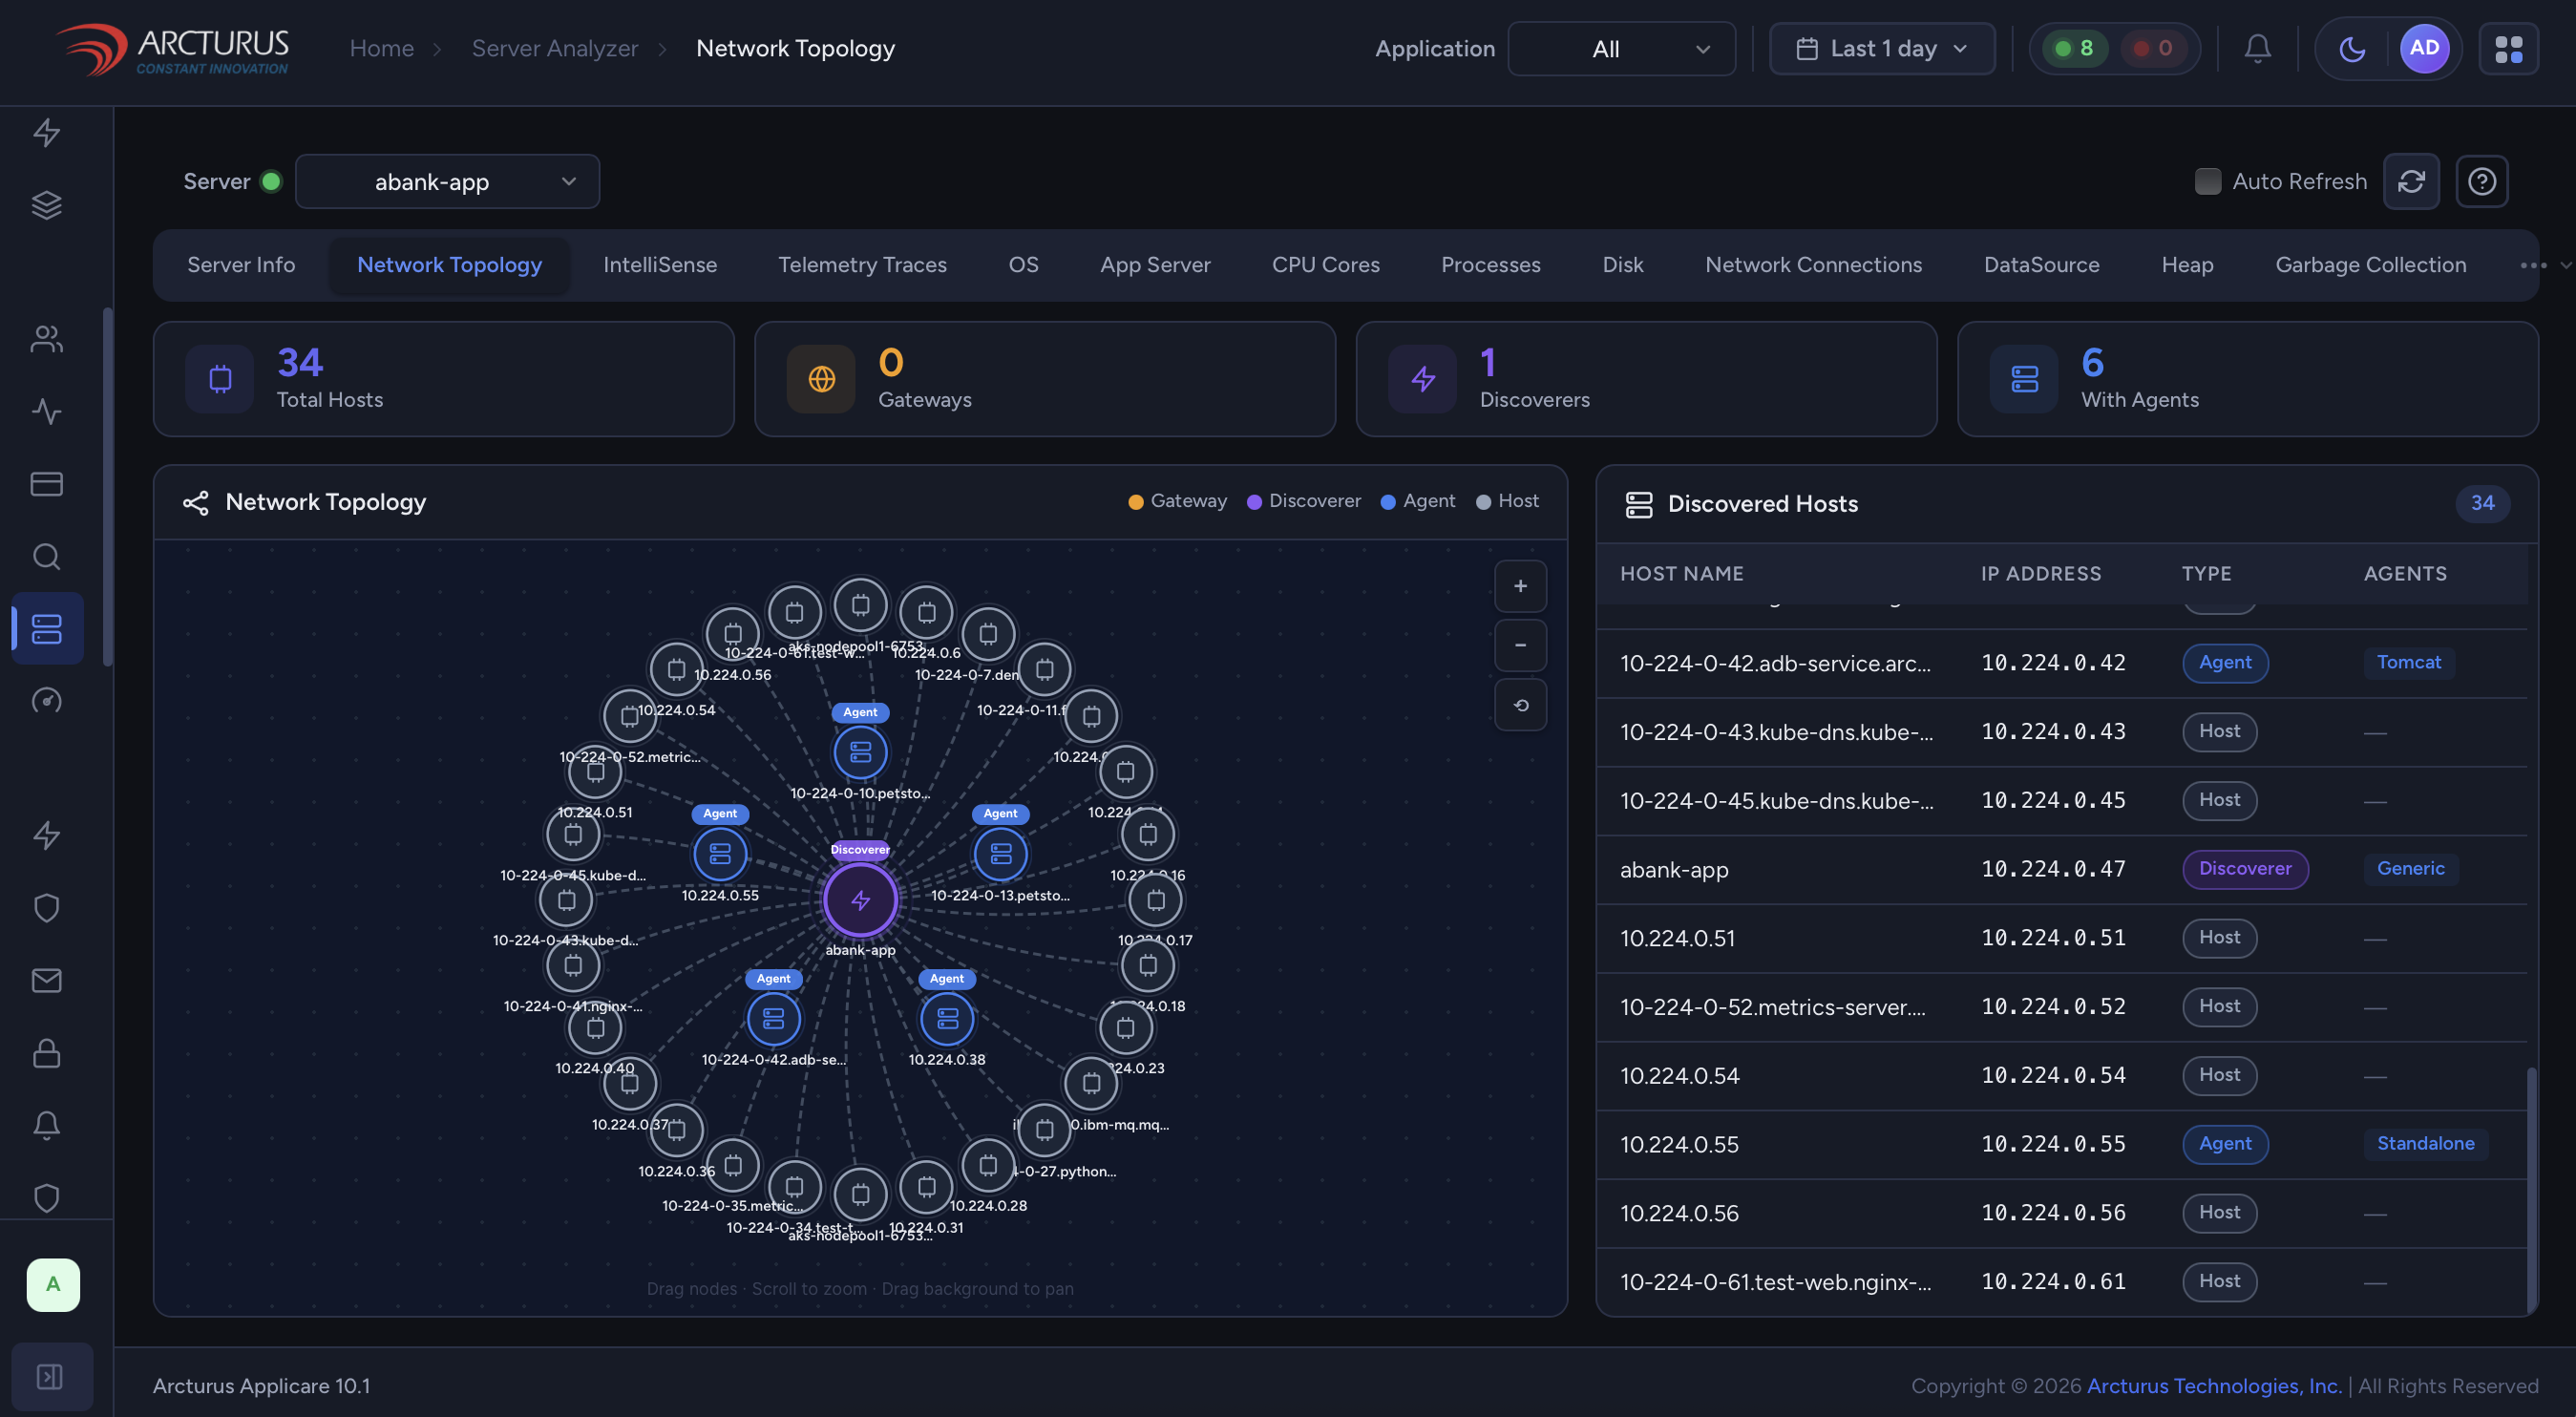
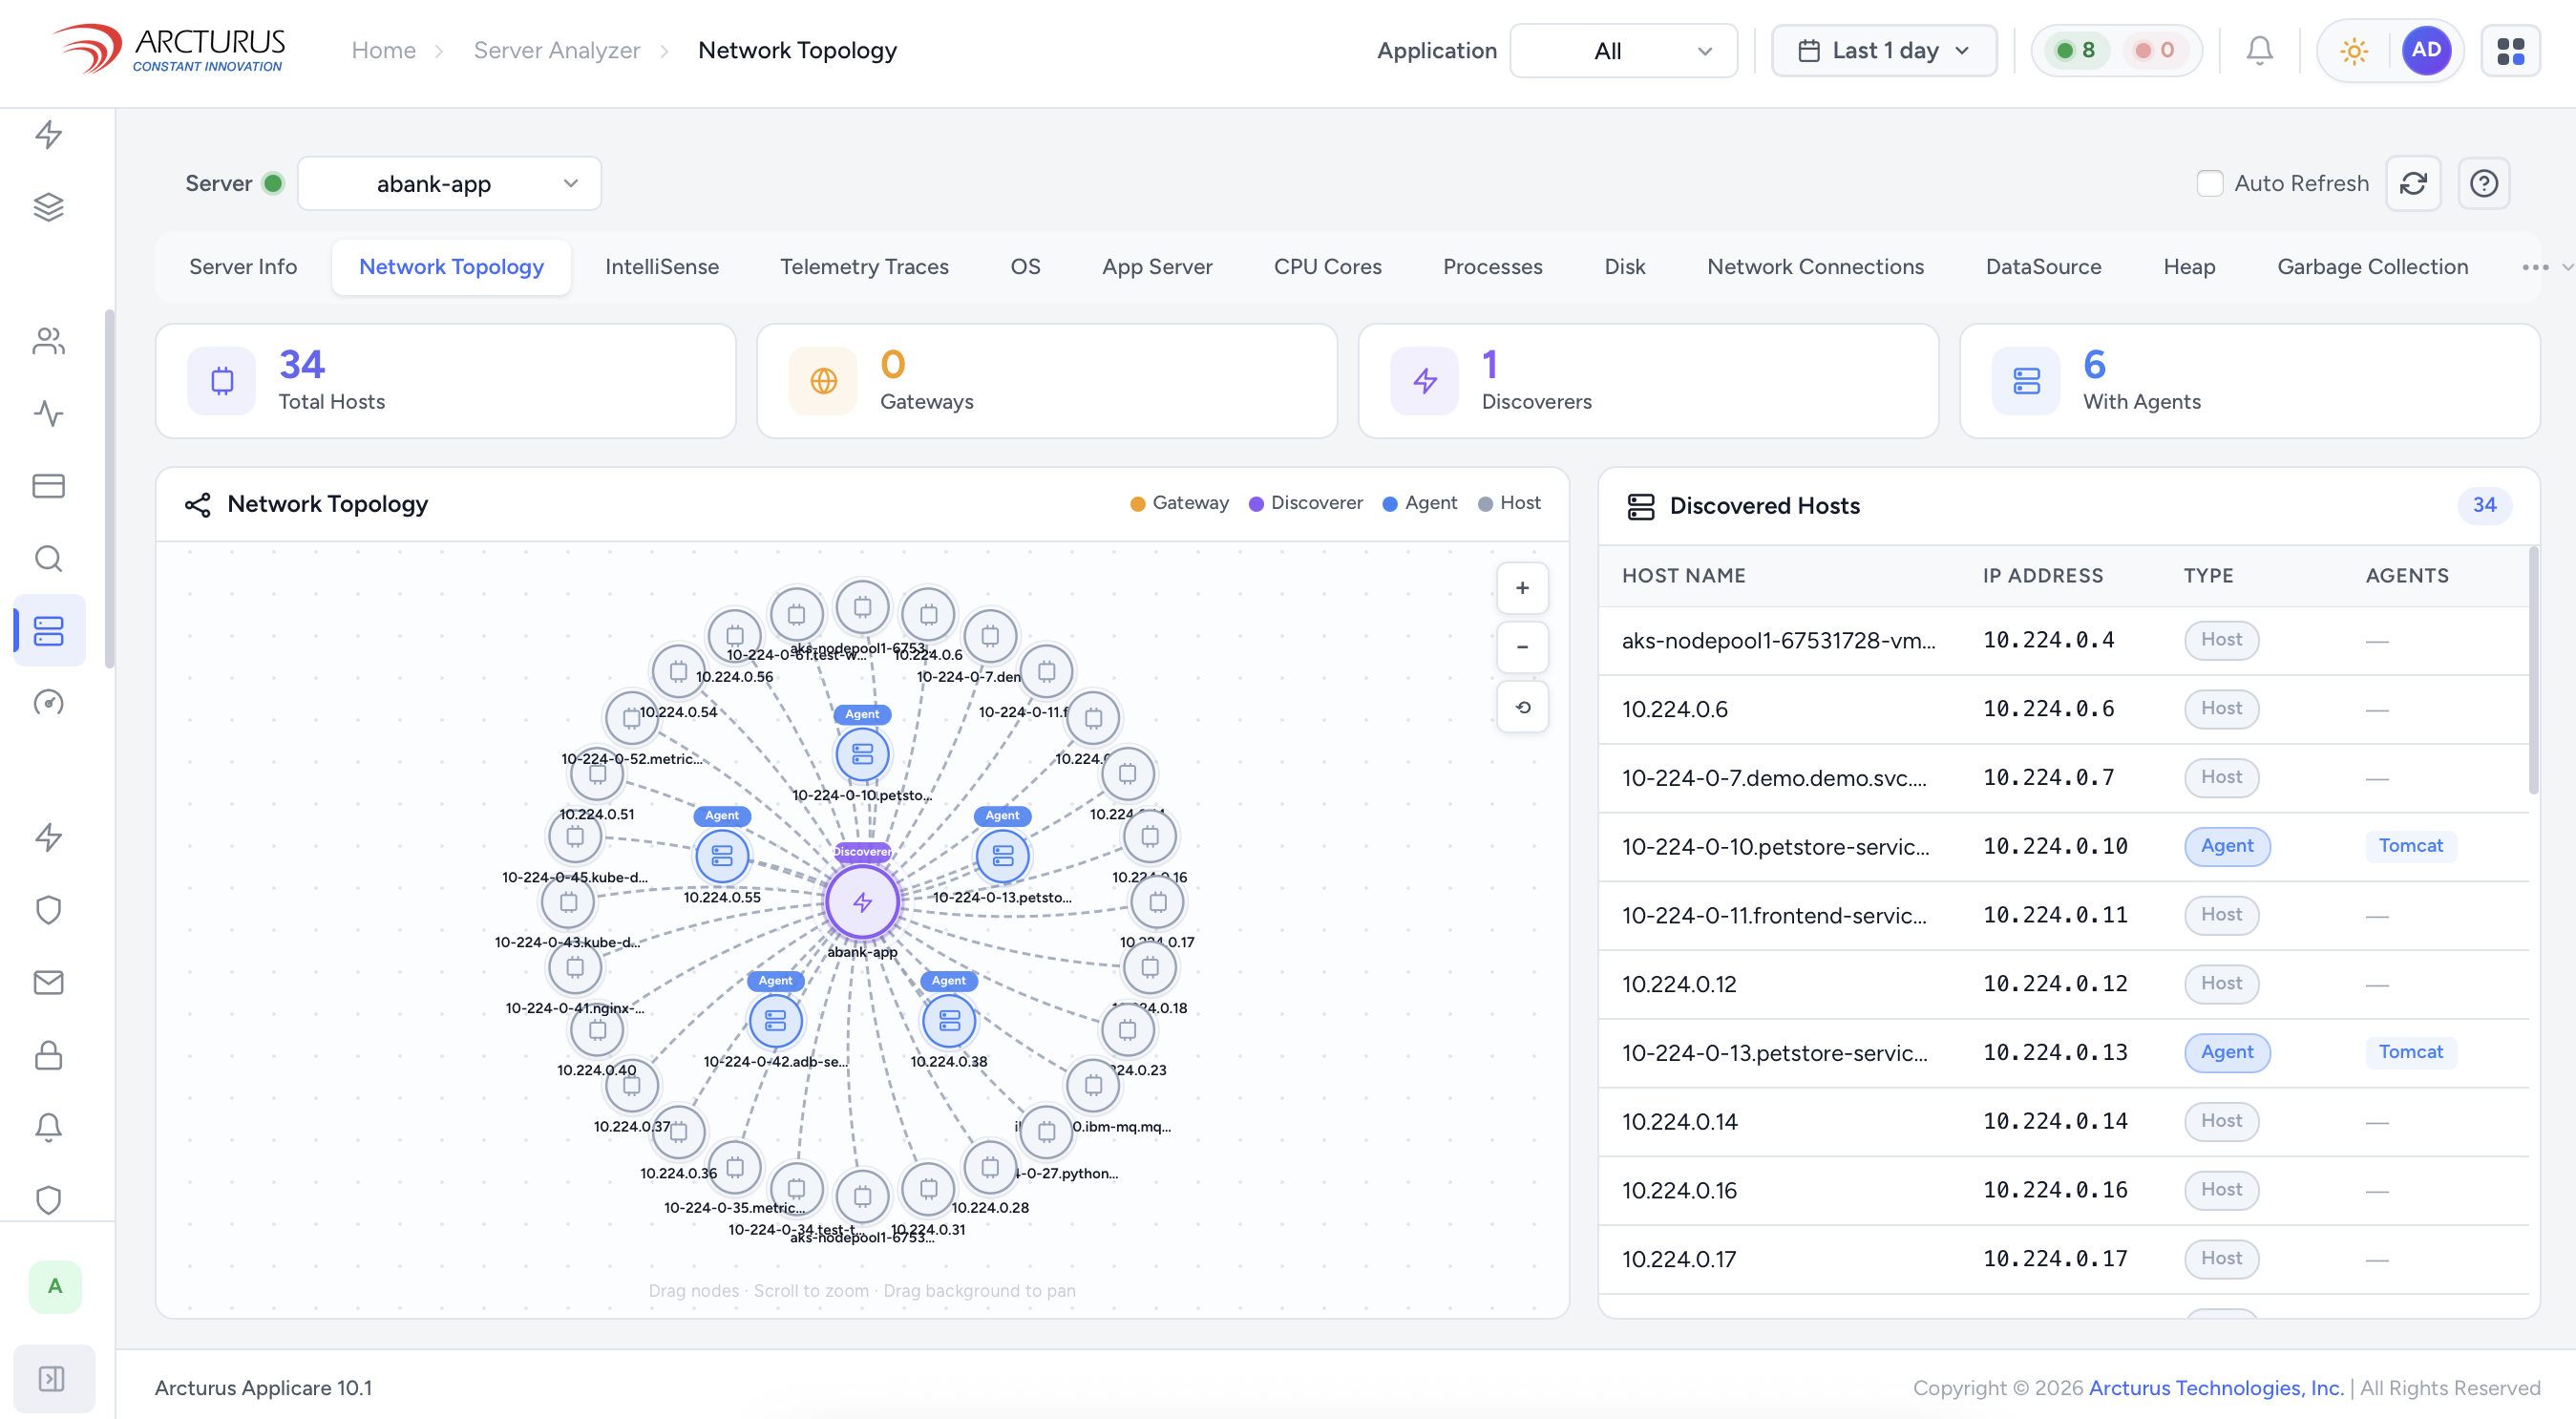
Applicare 10.0 — Network Topology · Auto-discovery across your entire infrastructure in under 12 seconds

Platform Architecture

Four engines.
One shared graph.

Every engine shares a single entity graph and a single data model — which is why they produce answers, not just more charts.

Engine 01
🕸️
Entity Graph
The causal topology of your entire environment
Every service, host, container, database, cloud resource, and external dependency — modelled with auto-discovered causal relationships. Rebuilt in under 12 seconds when anything changes. No manual CMDB. No topology files. No service map maintenance.
340 entities · 4,720 causal links · <12s rebuild
Entity Graph · Live⬤ Live
Services
340
100% instrumented
Graph age
<12s
Rebuilt continuously
Causal links
4,720
Auto-discovered
Signal volume
1B+/day
Zero sampling
deploy #6207 → 3 new services added (cart-v2, promo-svc, ab-router). 12 new causal links discovered automatically.
Engine 02
🧠
ArcIn AI
Root cause in plain English
Traverses the entity graph across 40+ services and returns root cause with a specific fix — in under 60 seconds, any language, any skill level. No PromQL. No SRE escalation.
<60s · any language · code-level fix
→ Why is checkout-svc p99 high?
ArcIn: deploy #6205, N+1 in OrderRepository. Fix: .include(:items)
Learn more about ArcIn AI →
Engine 03
IntelliTune
Self-healing within your policy gates
200+ remediation patterns for K8s, AWS, Linux, and databases — executing in 400ms within your defined policy boundaries. 80% of on-call pages never happen.
400ms · 200+ patterns · 80% page reduction
Connection pool exhausted✓ 380ms
OOMKill · api-gateway✓ 290ms
Cert expiry in 48h✓ auto-renewed
Engine 04
👁️
IntelliSense
Anomaly detection — zero alert rules
Per-entity behavioural baselines — flags deviations including zero-day patterns no signature database contains. Lateral movement, abnormal egress, privilege escalation, container escape — detected in real time, no threshold configuration required.
Zero alert rules · zero-day detection · real time
Live detections
⚠ Anomalous egress · auth-service
→ 54.239.x.x · 3.2MB · no prior pattern
✓ Drift detected · auto-classified
checkout-svc spike → deploy regression, not anomaly
⚠ IAM privilege escalation path
New role policy: s3:* without resource scope
How It Works

From signal to resolution.
Under 60 seconds.

The platform operates as a continuous loop — every step feeds the next, which is why Applicare resolves incidents while other tools are still sending alerts.

1
Ingest every signal
One agent. Metrics, traces, logs, deploys, cloud costs, security telemetry — 1B+ events/day, zero sampling.
All signals · zero sampling
2
Build entity graph
Every signal mapped to an entity. Causal relationships auto-discovered. New services appear in <12s.
<12s rebuild · auto-discovered
3
Detect anomalies
IntelliSense monitors per-entity baselines. Three alerts become one incident with one causal chain.
Zero alert rules · cross-service
4
Explain in plain English
ArcIn traverses the graph — specific service, specific commit, specific fix. Any language, any skill level.
Plain English · code-level fix
5
Resolve automatically
IntelliTune executes the fix in 400ms within policy gates. 80% of on-call pages never happen.
400ms · 80% page reduction
Platform Capabilities

What the platform covers.

Every capability is powered by the same four engines and the same entity graph — seamless by design.

📊
Full-Stack Observability
Every signal, every layer, one causal view. Metrics, traces, logs, and events correlated across your entire stack.
🔗
Distributed Tracing
10M spans/minute, zero head sampling. Every trace linked to its entity, deploy, and log context.
🗄️
Database Monitoring
Slow queries attributed to the exact application code. N+1 patterns, missing indexes — surfaced automatically.
👤
Digital Experience
Real user sessions, Core Web Vitals, and synthetic monitoring — correlated with backend services.
🏗️
Platform Engineering
Integrates with Backstage, Port, and custom IDPs. Golden path health gates and self-service SLO dashboards.
🔒
Security Posture Mgmt
NIST 800-53, FedRAMP, CMMC, SOC 2 (pursuing) — continuously monitored. ATO evidence generated on-demand.
Why It's Different

A causal model,
not a correlation engine.

Traditional tools correlate alerts. Applicare builds a causal model — which is why it answers questions the others can't.

CapabilityTraditional monitoringApplicare
Root causeAlert correlation — you still diagnoseCausal graph traversal — specific cause in <60s
Incident resolutionManual runbook executionIntelliTune auto-remediation in 400ms
Service topologyManual CMDB maintenanceAuto-discovered, rebuilt in <12s
Alert setupHundreds of threshold rulesZero alert rules — IntelliSense per entity
Log queryingSPL / KQL expertise requiredPlain English via ArcIn, any language
Anomaly detectionSignature-based — misses zero-daysBehavioural baselines — catches zero-days
Deploy correlationManual tagging or separate APMAutomatic — every deploy linked to entity impact
Tools required3–5 stitched togetherOne platform. One graph. One answer.
Start 14-day free trial → Browse solutions →