Turn telemetry into
operational certainty.
Applicare delivers full-stack observability — metrics, traces, and logs unified with AI-driven correlation in one platform — so your platform, SRE, and operations teams resolve incidents faster, cut alert noise, and run cloud-native at scale with confidence. Not just dashboards. Answers.
Cloud-native moved fast.
Observability didn't keep up.
Microservices, Kubernetes, and continuous delivery multiplied your telemetry — and your blind spots. Most teams have more dashboards than answers. These are the patterns Applicare is built to fix.
One platform for metrics, traces, and logs — at enterprise scale.
Applicare unifies full-stack telemetry into a single, high-cardinality analytics engine built for cloud-native operations — with AI-driven intelligence built in.
db.query after deploy v2.3.1 — 340ms slower than baseline. Suggested owner notified.Full-stack visibility, engineered for scale.
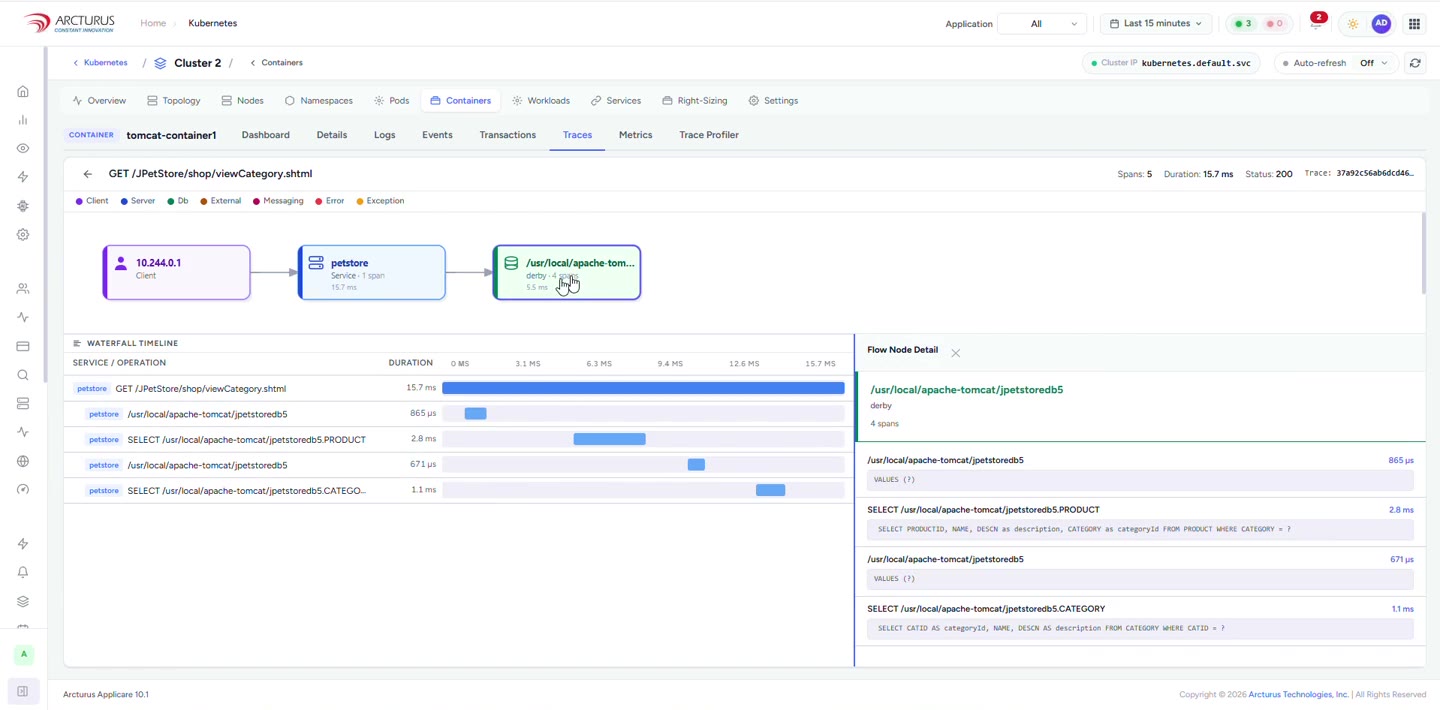
Trace every transaction to the slow endpoint.
App Analyzer breaks down live HTTP traffic by endpoint — call volume, error counts, and response-time percentiles — so you can see exactly which transactions are slow or failing. It's the request-level view inside Applicare's full-stack tracing, linking each endpoint back to the traces, deploys, and logs behind it.
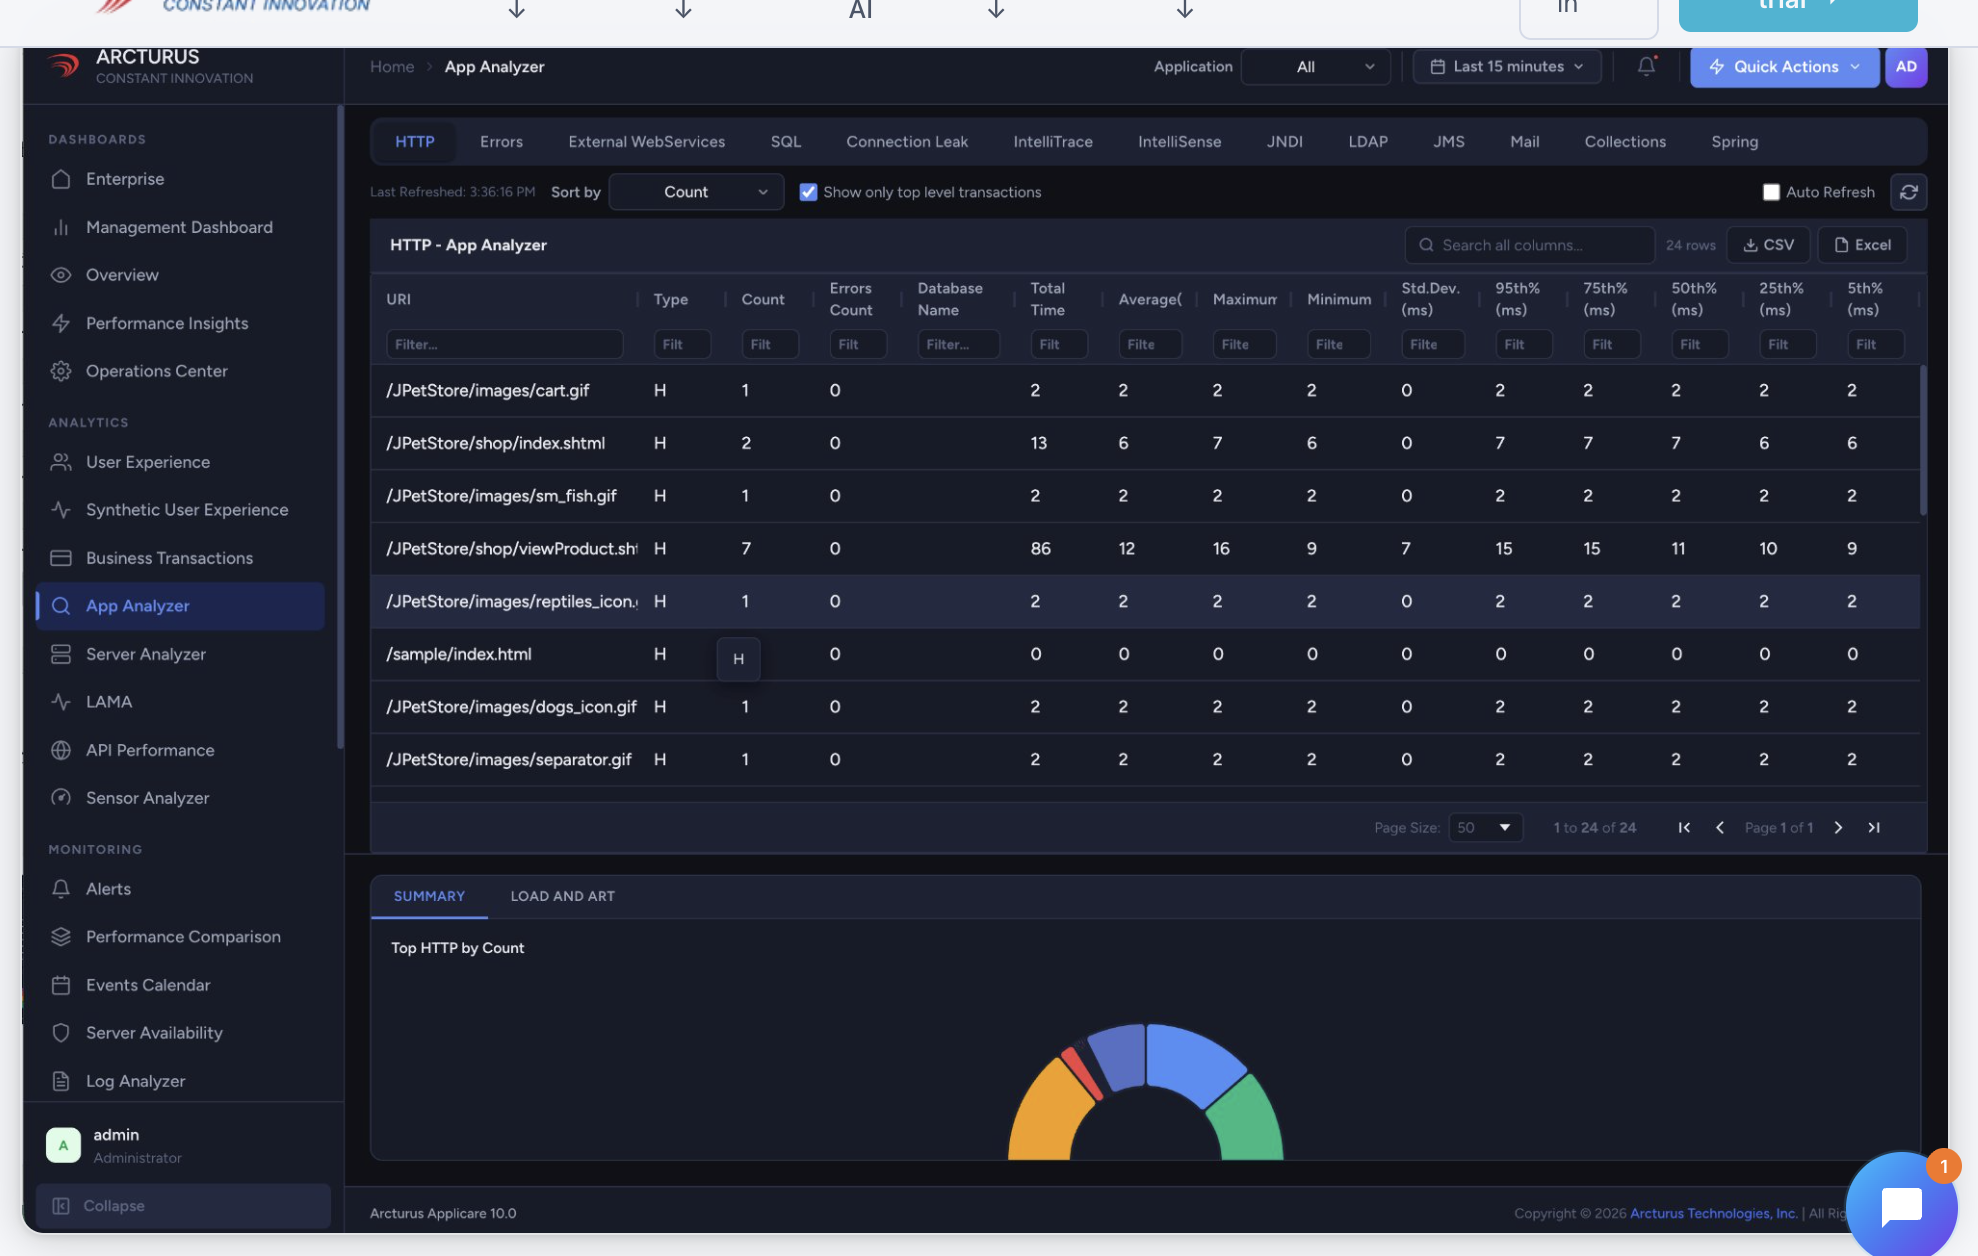
App Analyzer — HTTP transaction performance, part of Applicare's full-stack tracing
From application to action —
one telemetry pipeline.
Applicare is OpenTelemetry-native — ingest data from any OTel SDK or Collector with zero proprietary agents and zero vendor lock-in — then ArcIn turns signals into decisions, not just dashboards.
Continue with the complete lesson, configuration steps, and hands-on learning for more about Applicare in Applicare University.
Learn in Applicare University →Real teams. Measurable outcomes.
From retail to telecom, enterprises run on Applicare observability to cut alert noise, resolve incidents faster, and protect the customer experience.
- 82% fewer false-positive alerts
- Black Friday campaign readiness
- 41% fewer abandoned-cart incidents
- Faster engineering–business coordination
- 70% less war-room participation
- Audit-ready incident timelines, automatically
- Visibility across 500+ applications
- Higher change confidence for release teams
- 1,500+ engineering hours saved annually
- 2.5× higher release frequency
- Less context switching across tools
- Faster onboarding & productivity
- SLA compliance improved to 99.995%
- 58% fewer recurring incidents
- Confident, safe software upgrades
- Clear application-dependency visibility
- Global transaction visibility
- 63% fewer duplicate support tickets
- Hidden infrastructure bottlenecks found
- Better experience at peak demand
- 52% fewer buffering complaints
- More consistent streaming quality
- Accurate capacity planning
- Lower overprovisioning costs
- Visibility across distributed sites
- 68% less manual troubleshooting
- Faster production root-cause analysis
- Stronger IT–operations collaboration
- 85% lower alert volume
- Focus on high-priority incidents
- Shorter escalation chains
- Better reliability without more headcount
More than monitoring.
Operational intelligence, built in.
Tools alone don't transform operations — intelligence does. Applicare unifies full-stack telemetry, AI-driven correlation, and automation in one platform, so teams act on insight, not raw data.
Outcomes the board can measure.
Observability is an operational investment — and it should show up in the numbers that matter to the business.
Applicare + ArcIn = root cause in minutes.
ArcIn, the AI engine inside Applicare, layers correlation and context across all your telemetry — closing the gap between "something's wrong" and "here's why."
config-change #4821 on payments-api. Trace shows db.connpool exhaustion → upstream checkout-svc & cart-svc degraded.Full-stack observability, without the complexity.
See Applicare live on your environment, or start a free trial. Faster incident resolution, less alert noise, and measurable reliability — with AI-driven intelligence built in.
- Enterprise-grade platform
- OpenTelemetry-native
- Kubernetes & SRE ready
- AI-driven correlation