Solutions · Cloud Monitoring
One graph.
Every cloud.
Every service.
Applicare puts AWS, Azure, and GCP into a single causal entity graph — so cross-cloud incidents surface as one root cause, not three separate tickets.
Intelligence
Engine
“Applicare’s causal graph found the root cause in minutes — across three cloud environments simultaneously. That’s something no alert dashboard has ever done for us.”
One graph. Every dependency.
Applications, services, containers, and cloud resources — auto-discovered and connected in a single causal graph, updated continuously as your environment changes.
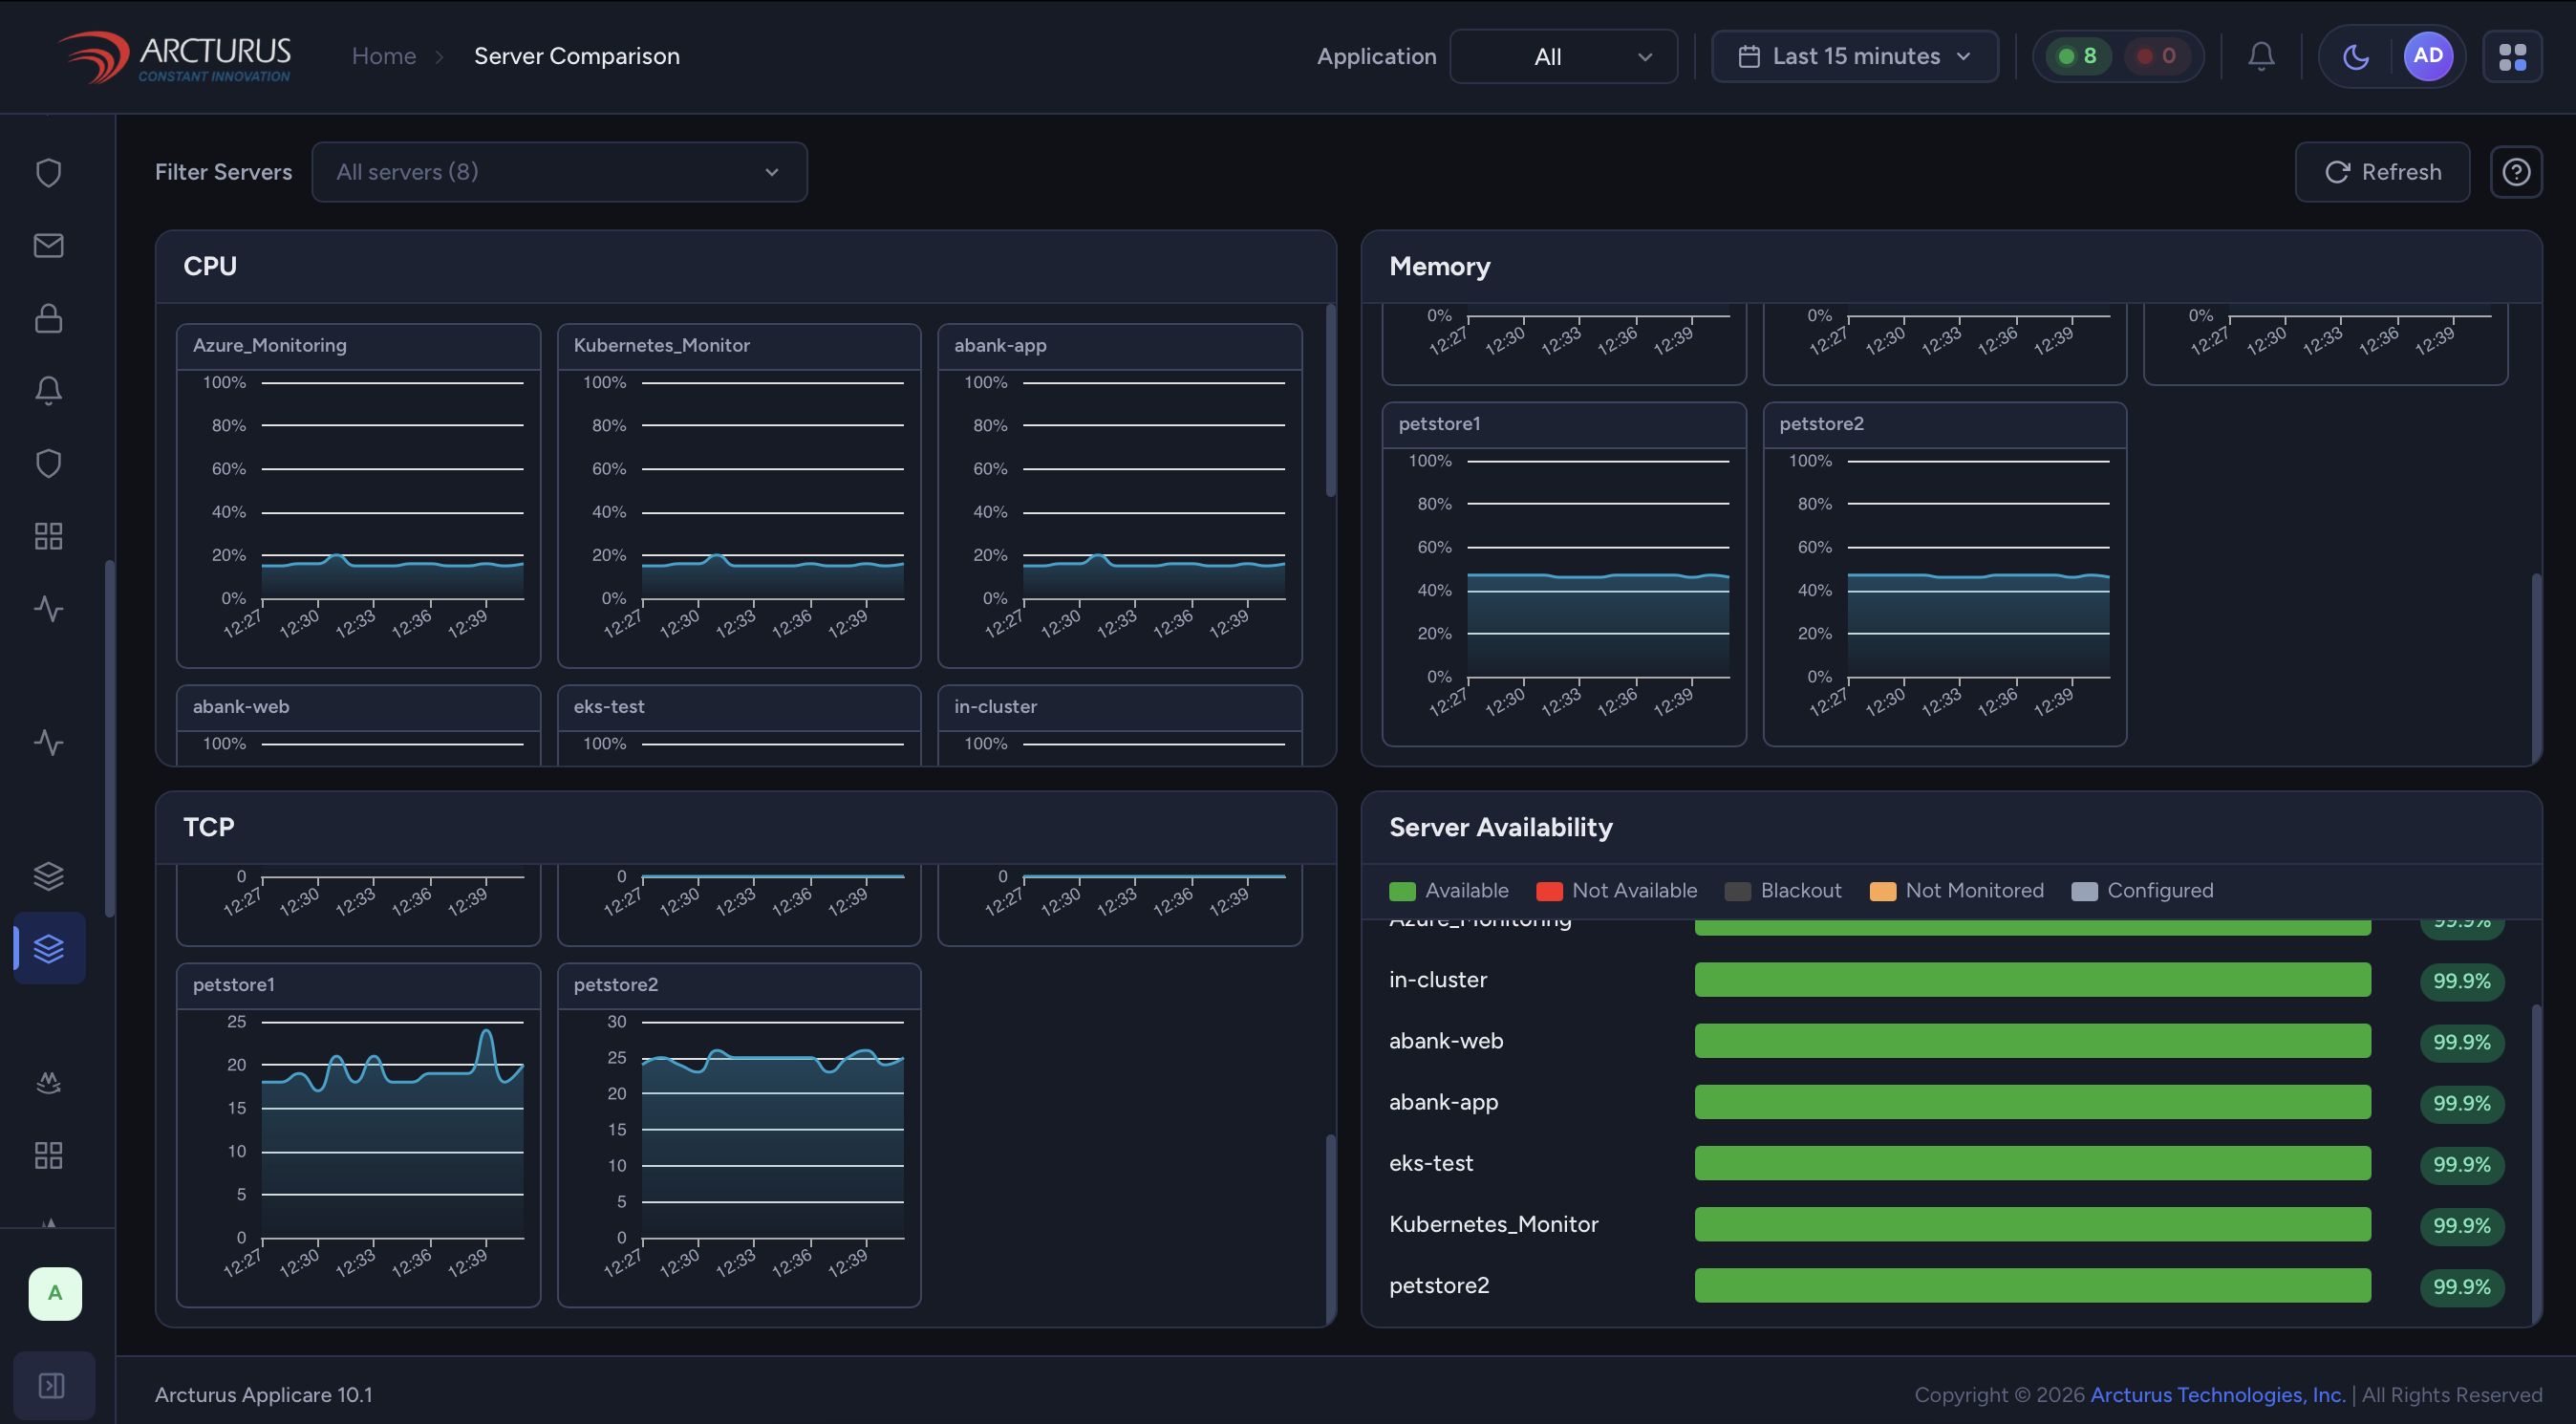
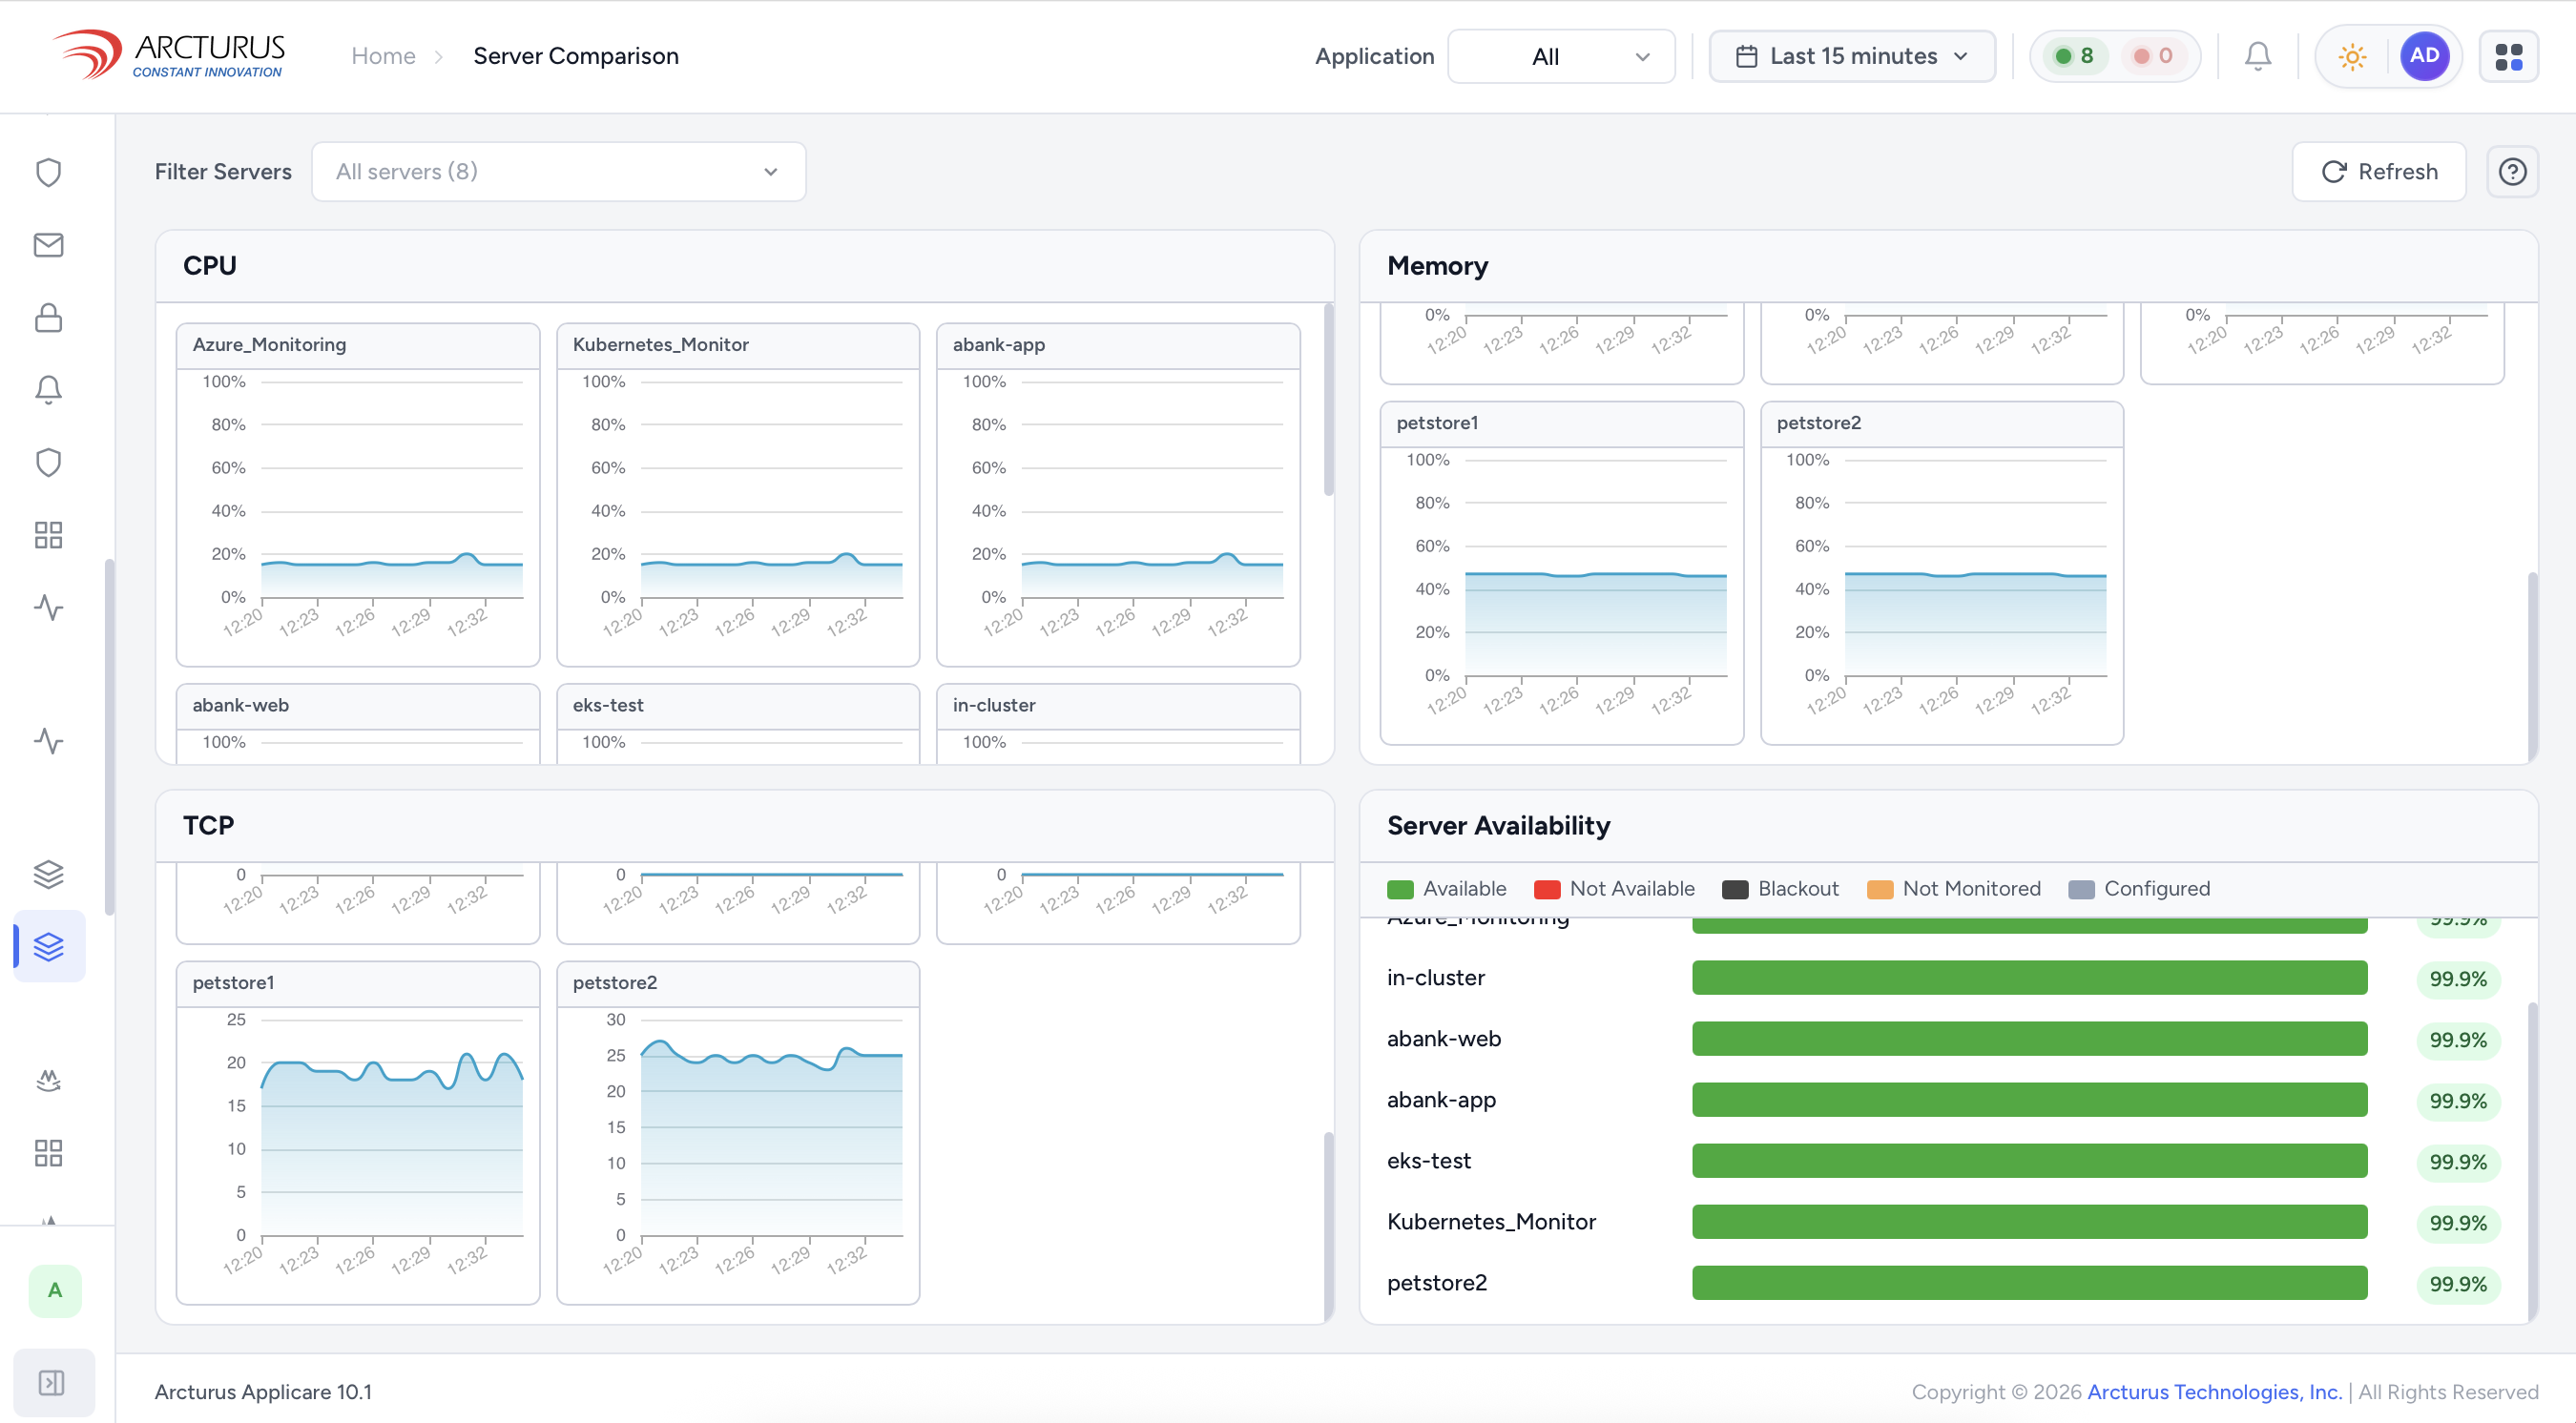
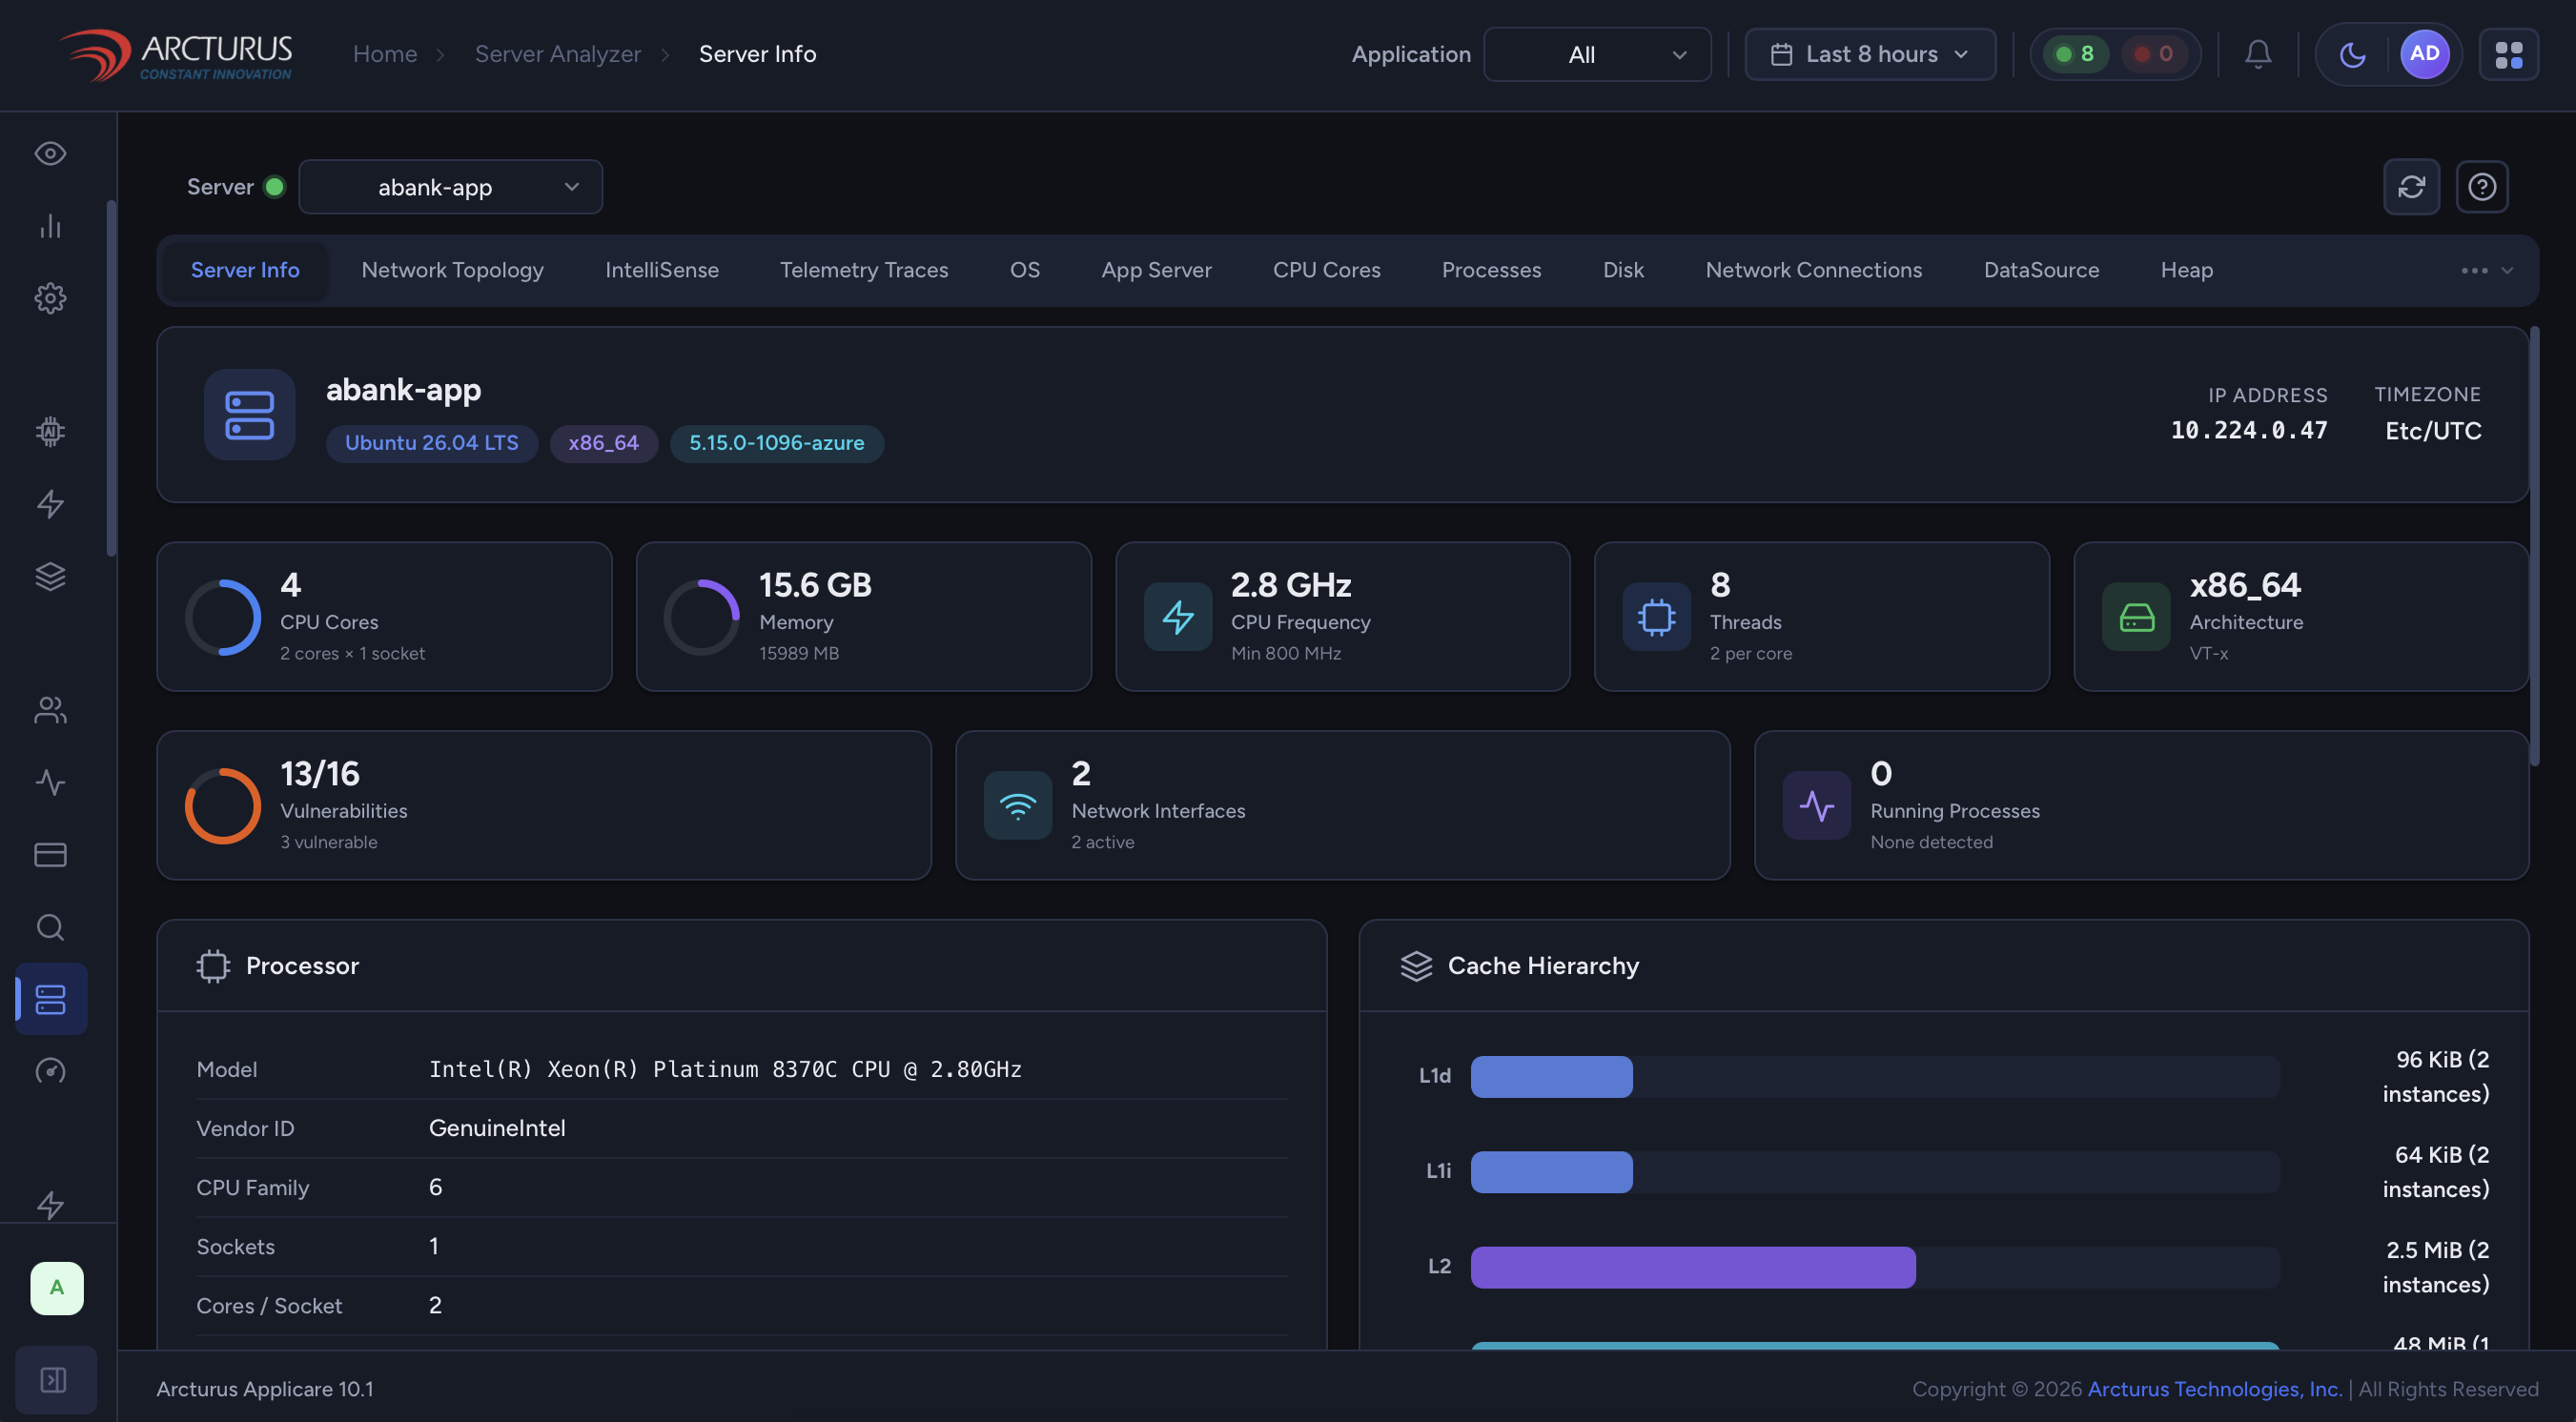
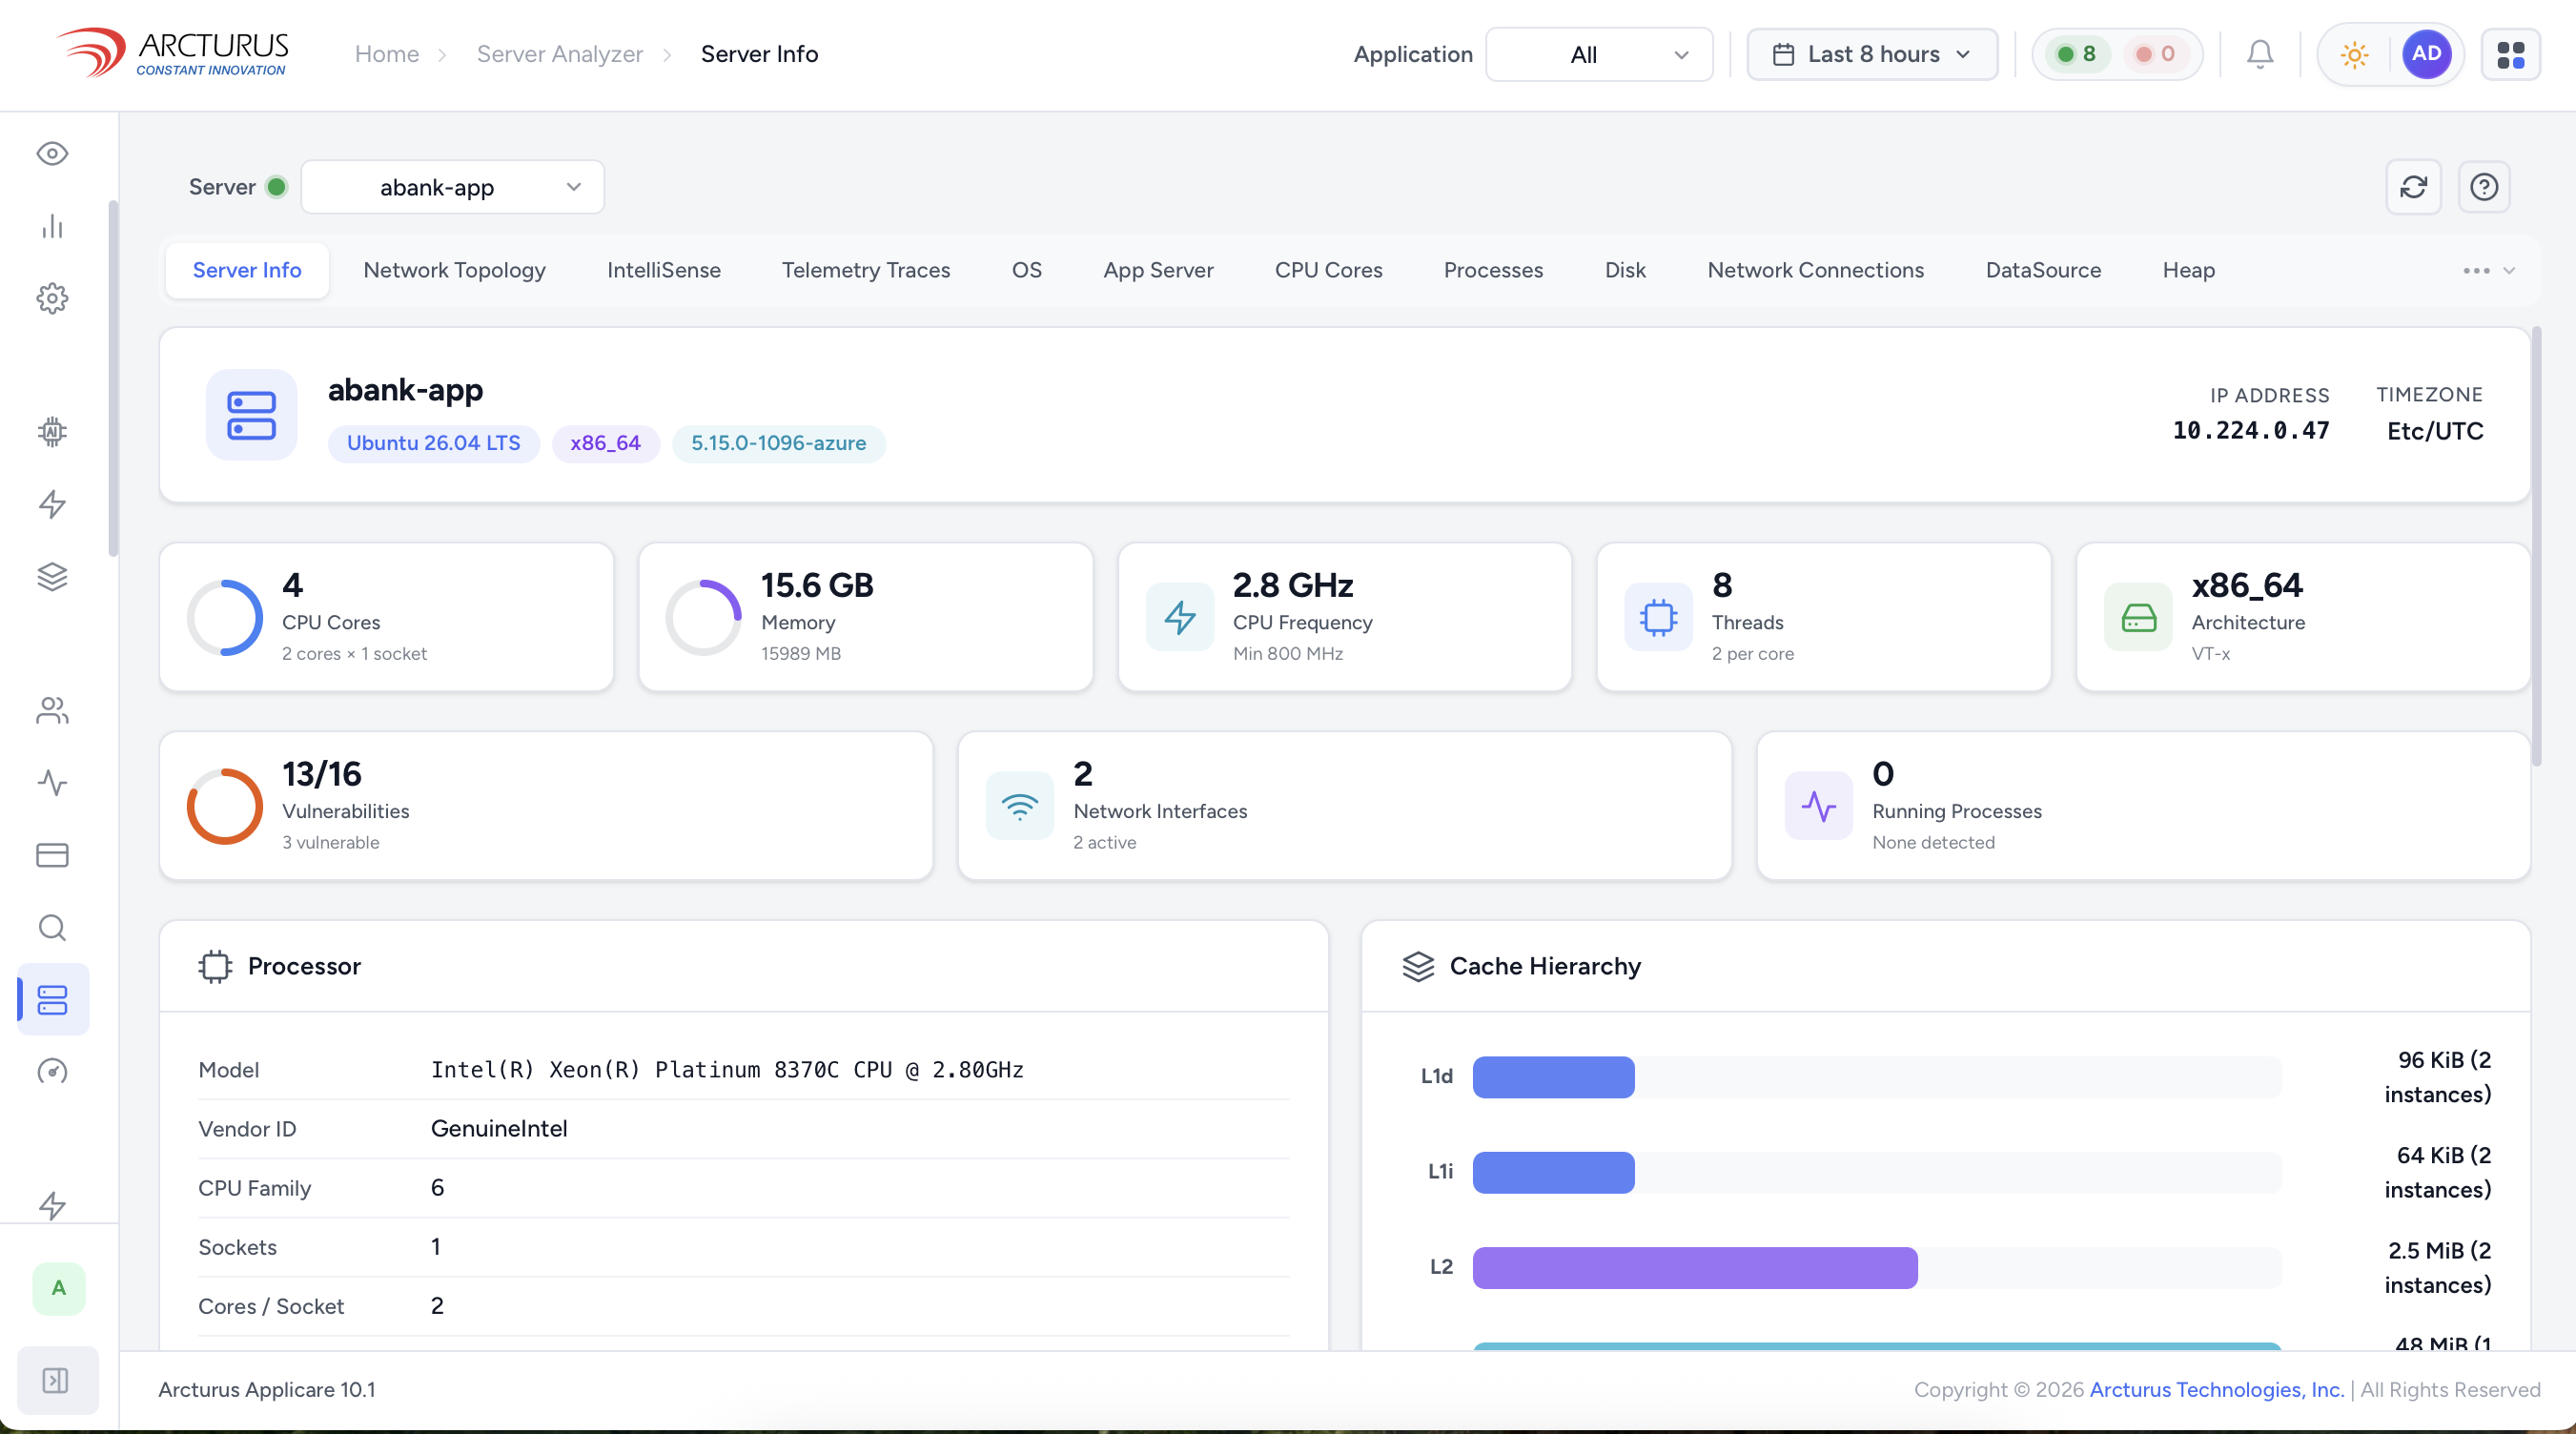
See health across every cloud, in one view.
No more tab-switching between the AWS, Azure, and GCP consoles. One dashboard, continuously updated.
Multi-cloud entity graph
One graph connects every cloud dependency
Most tools show you three separate dashboards. Applicare builds a single causal graph across AWS, Azure, and GCP — so when a GCP Pub/Sub backlog triggers AWS Lambda throttling, you see the chain immediately.
AI root cause analysis
One alert. One root cause. Not thirty.
When an incident cascades across cloud boundaries, traditional tools flood you with alerts — one per service, per provider. ArcIn AI reads the causal graph and surfaces the single upstream cause.
.include(:items) eager-load fixCross-cloud cost intelligence
Stop paying for cloud you’re not using
Applicare correlates your cloud spend with actual traffic and deploy events — so you can see exactly which workloads are over-provisioned and which reserved instances are going to waste.
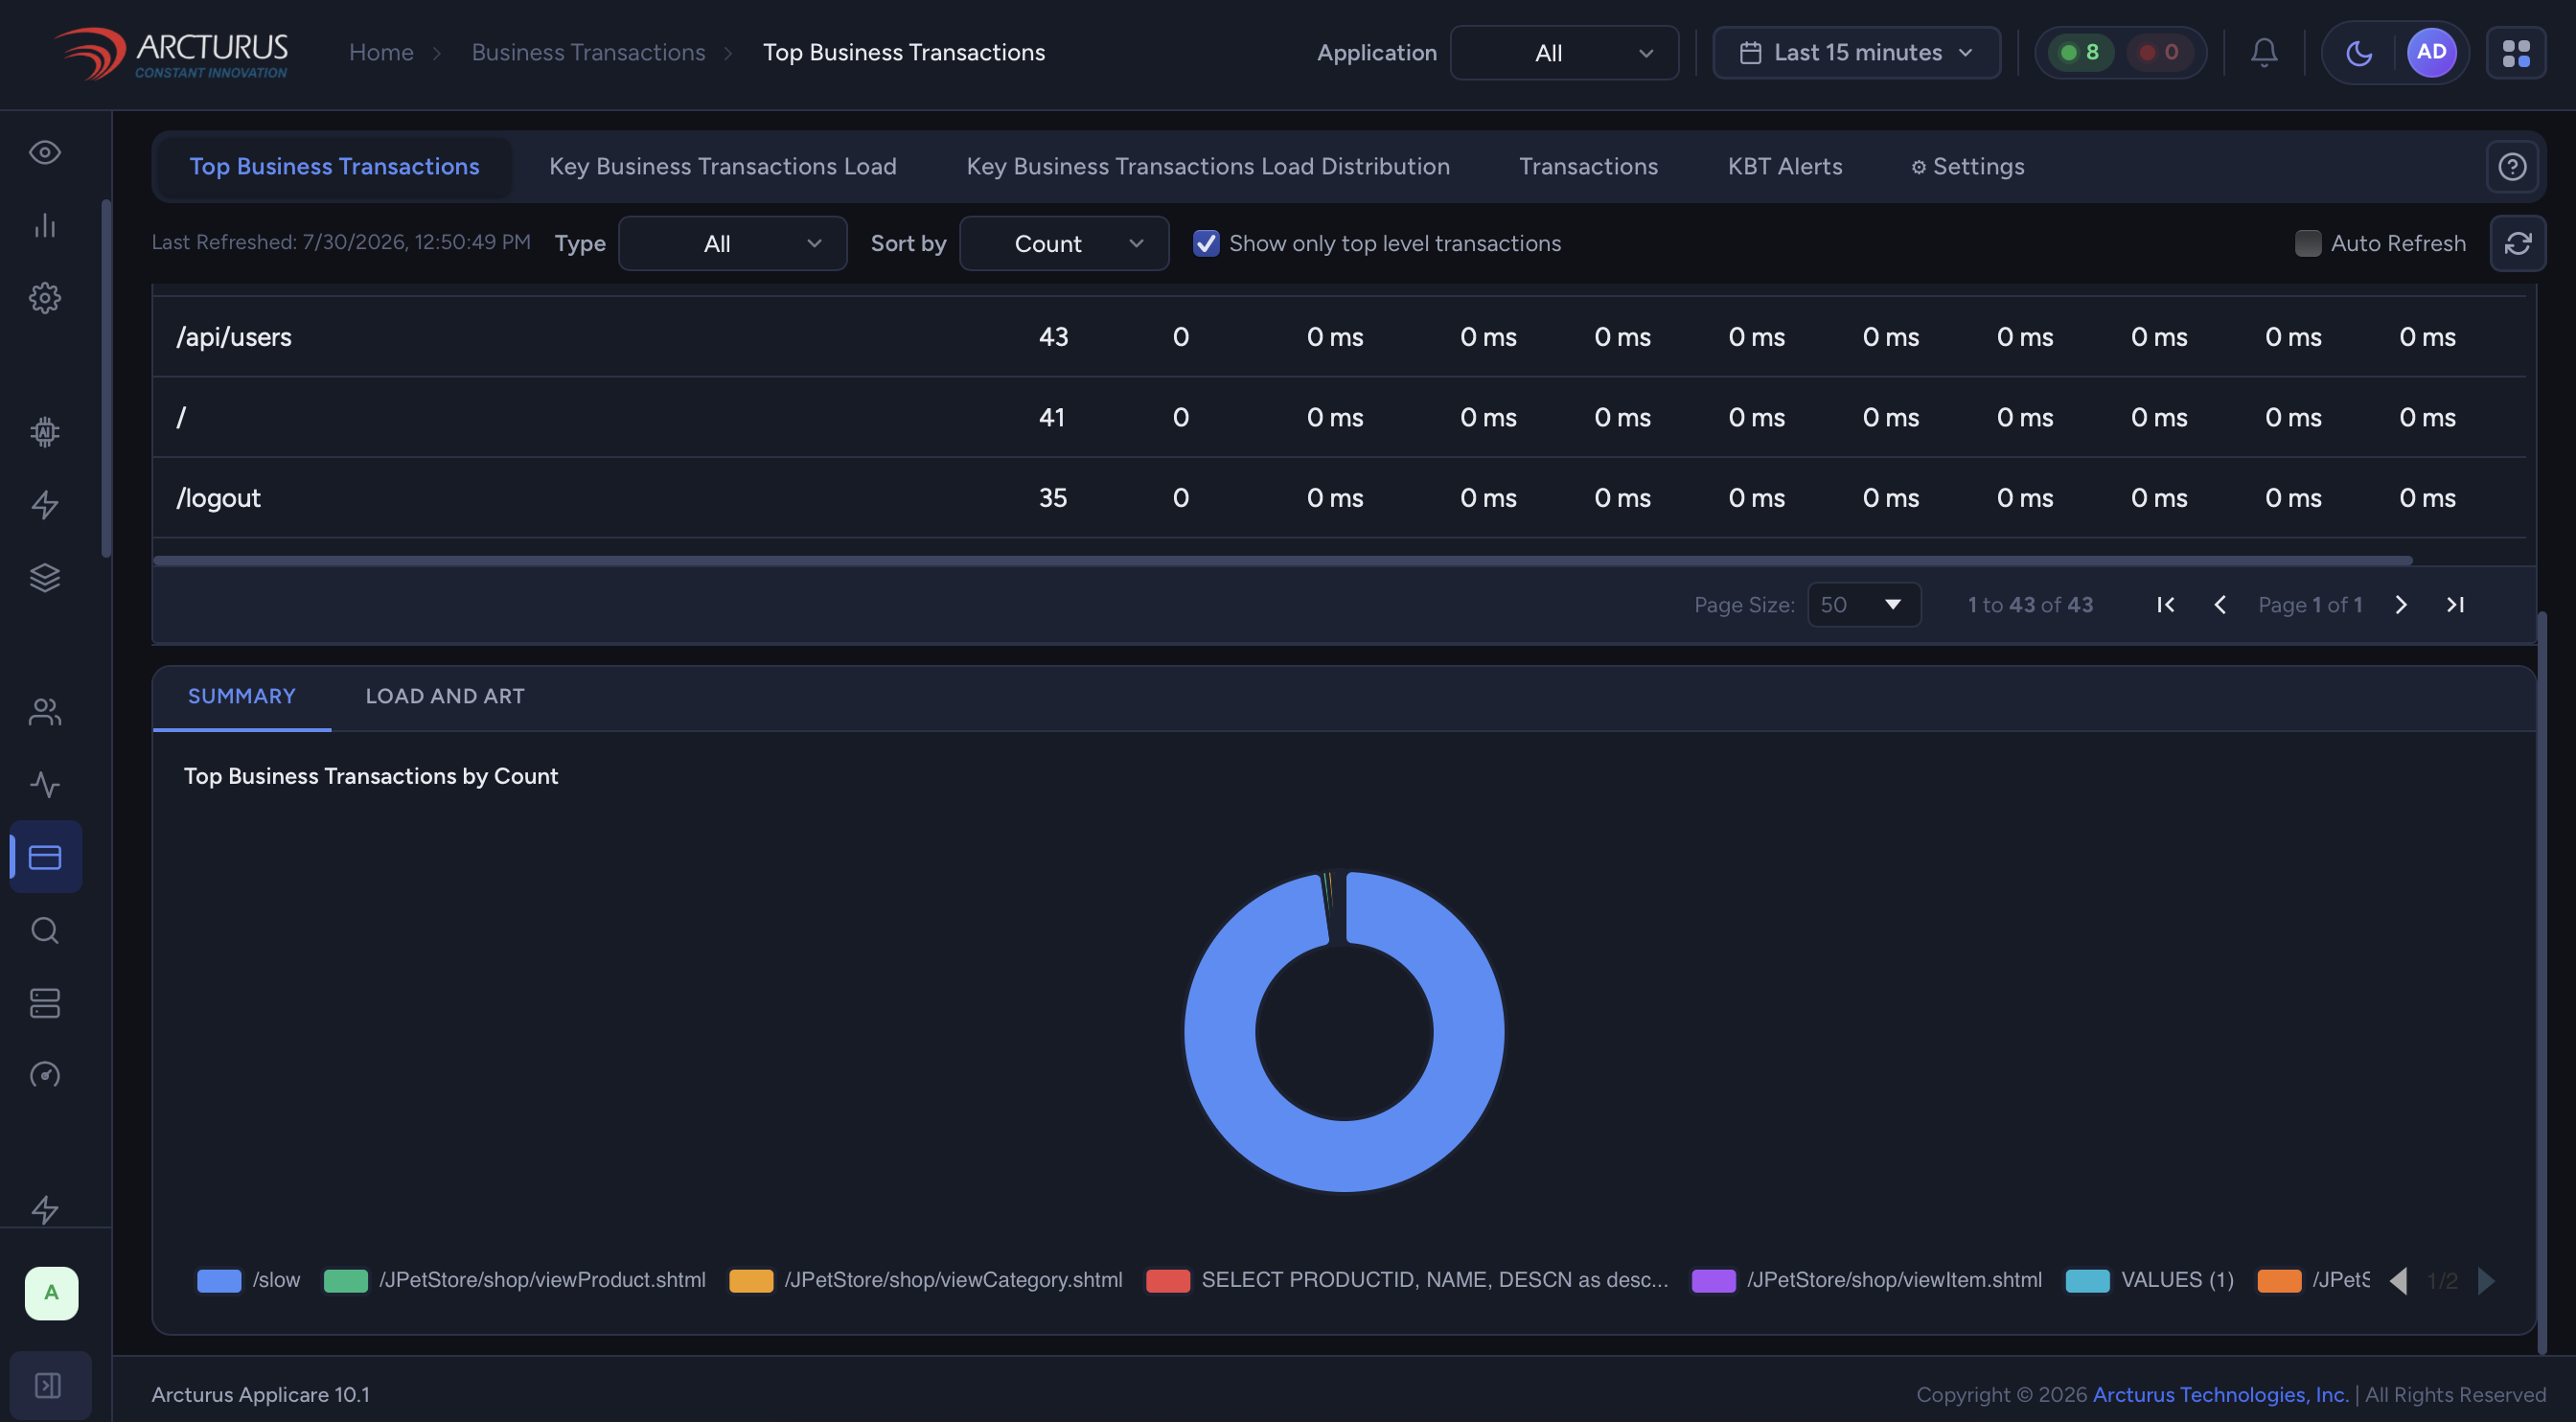
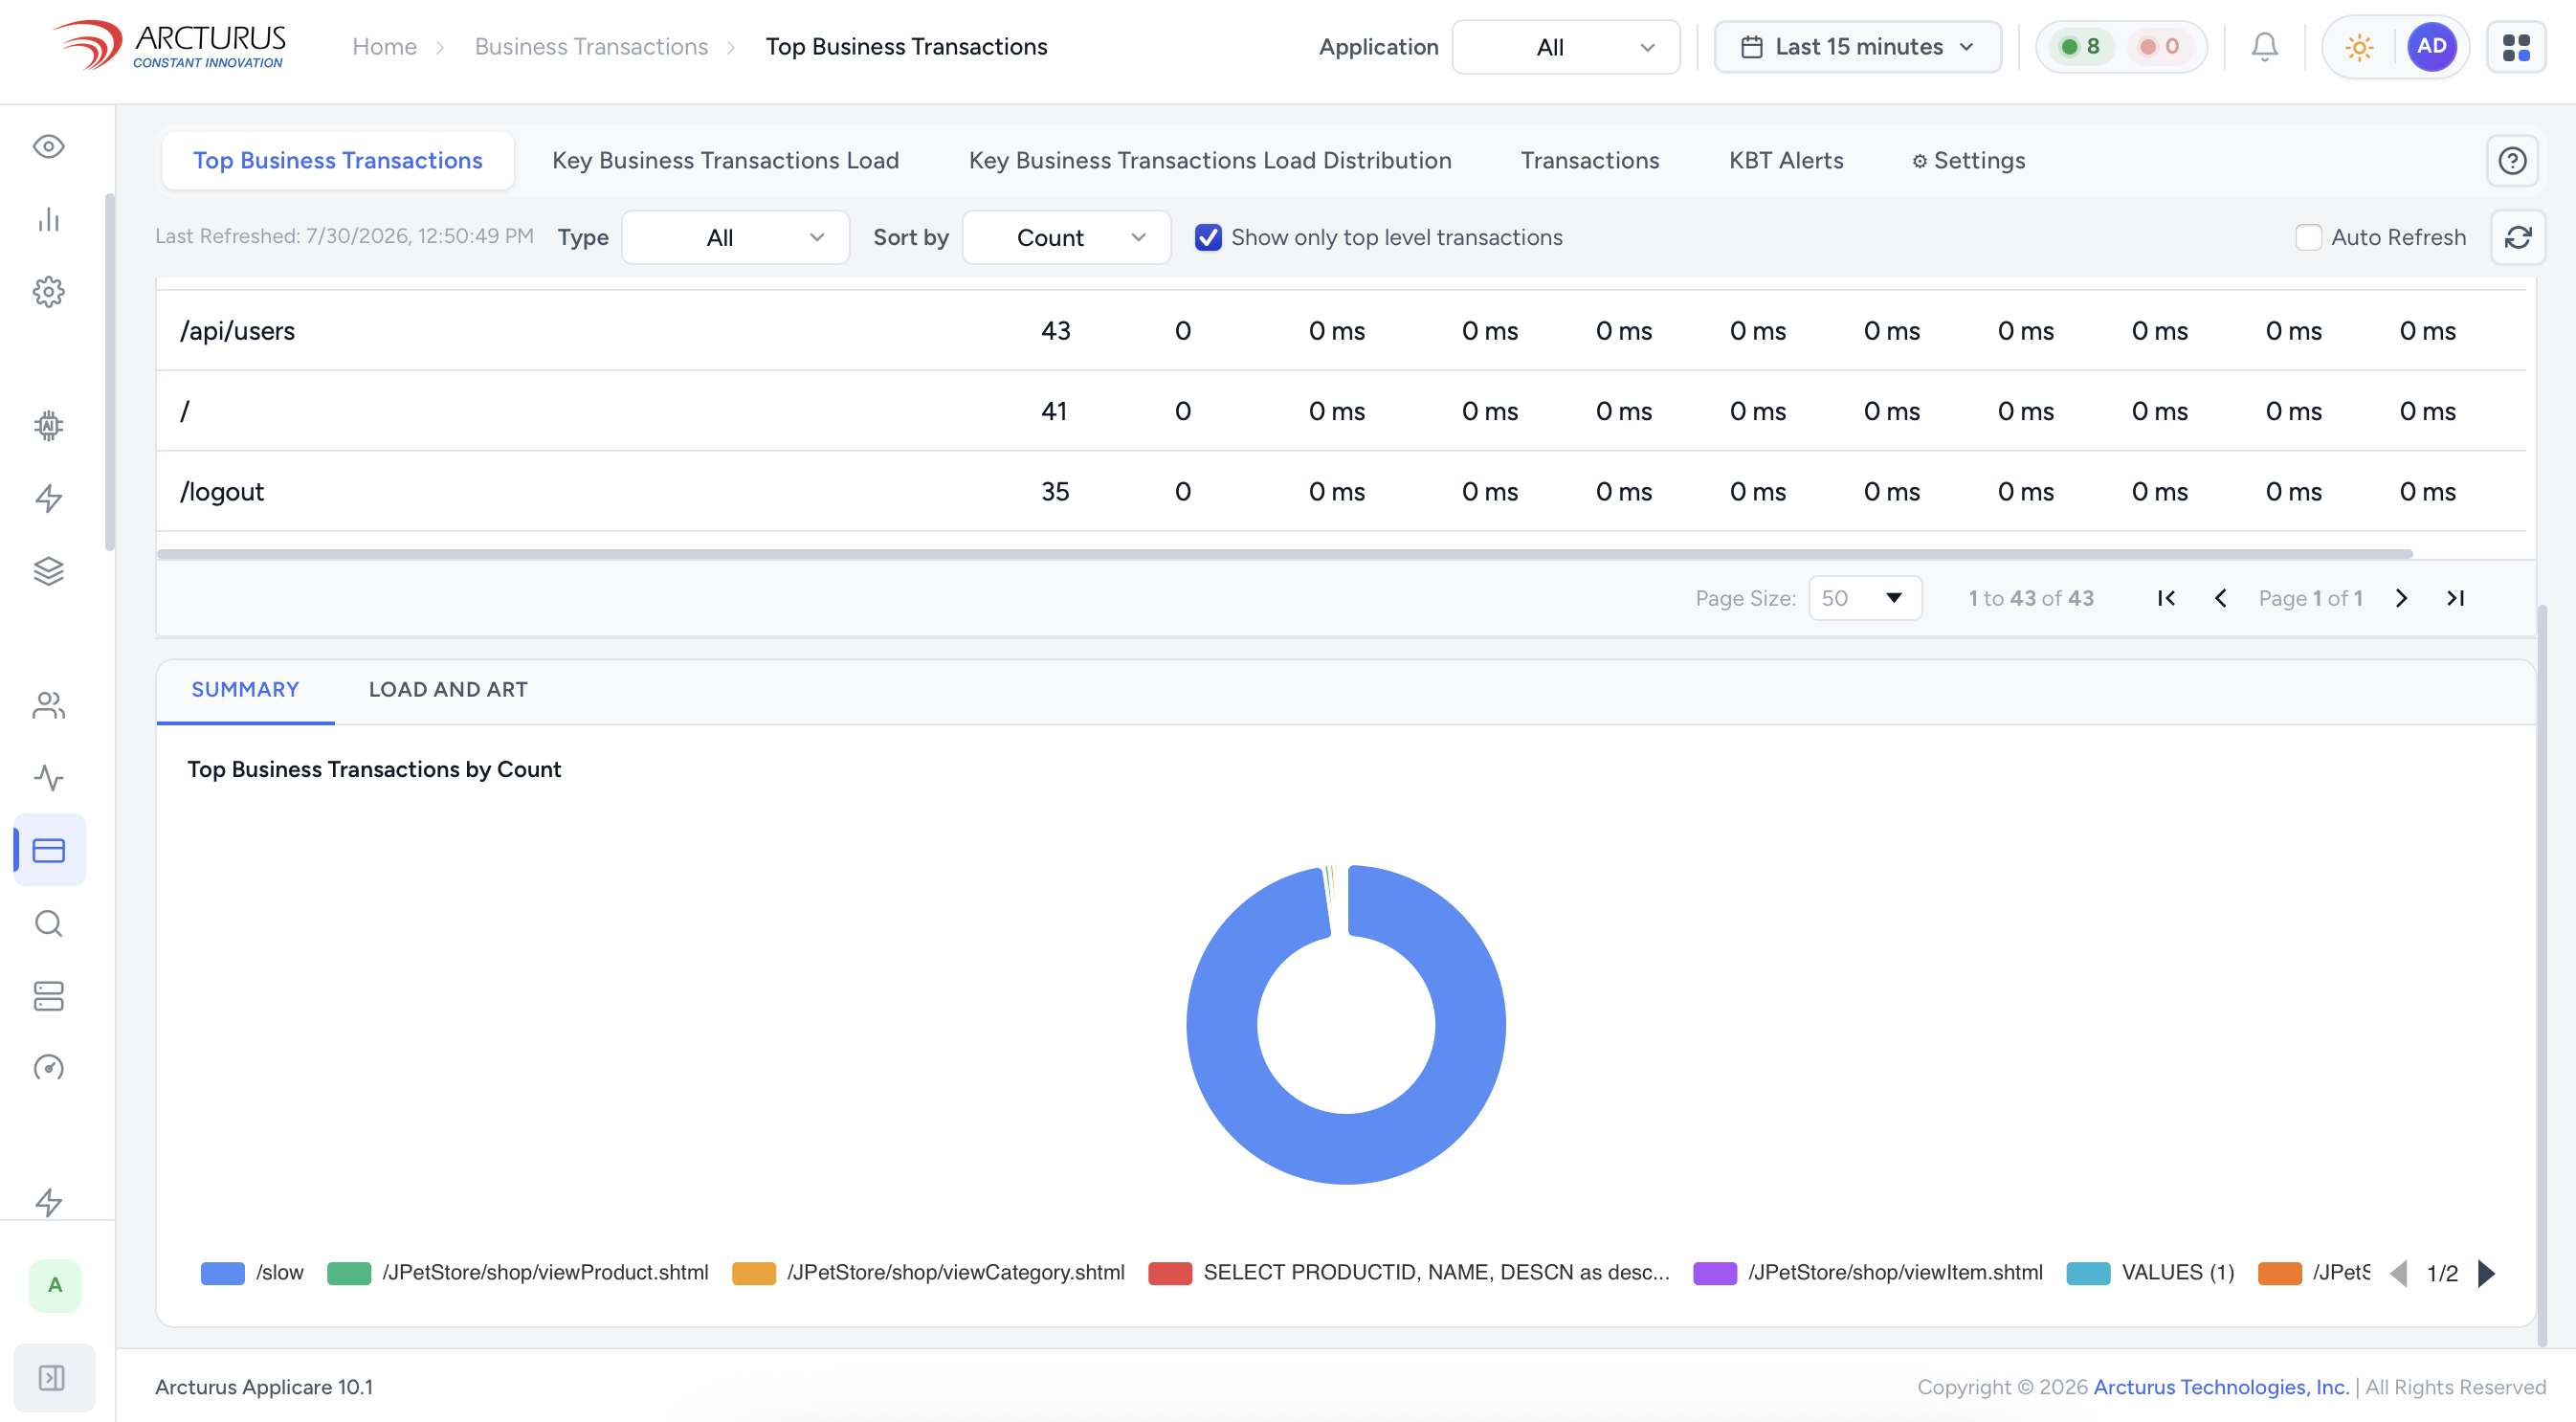
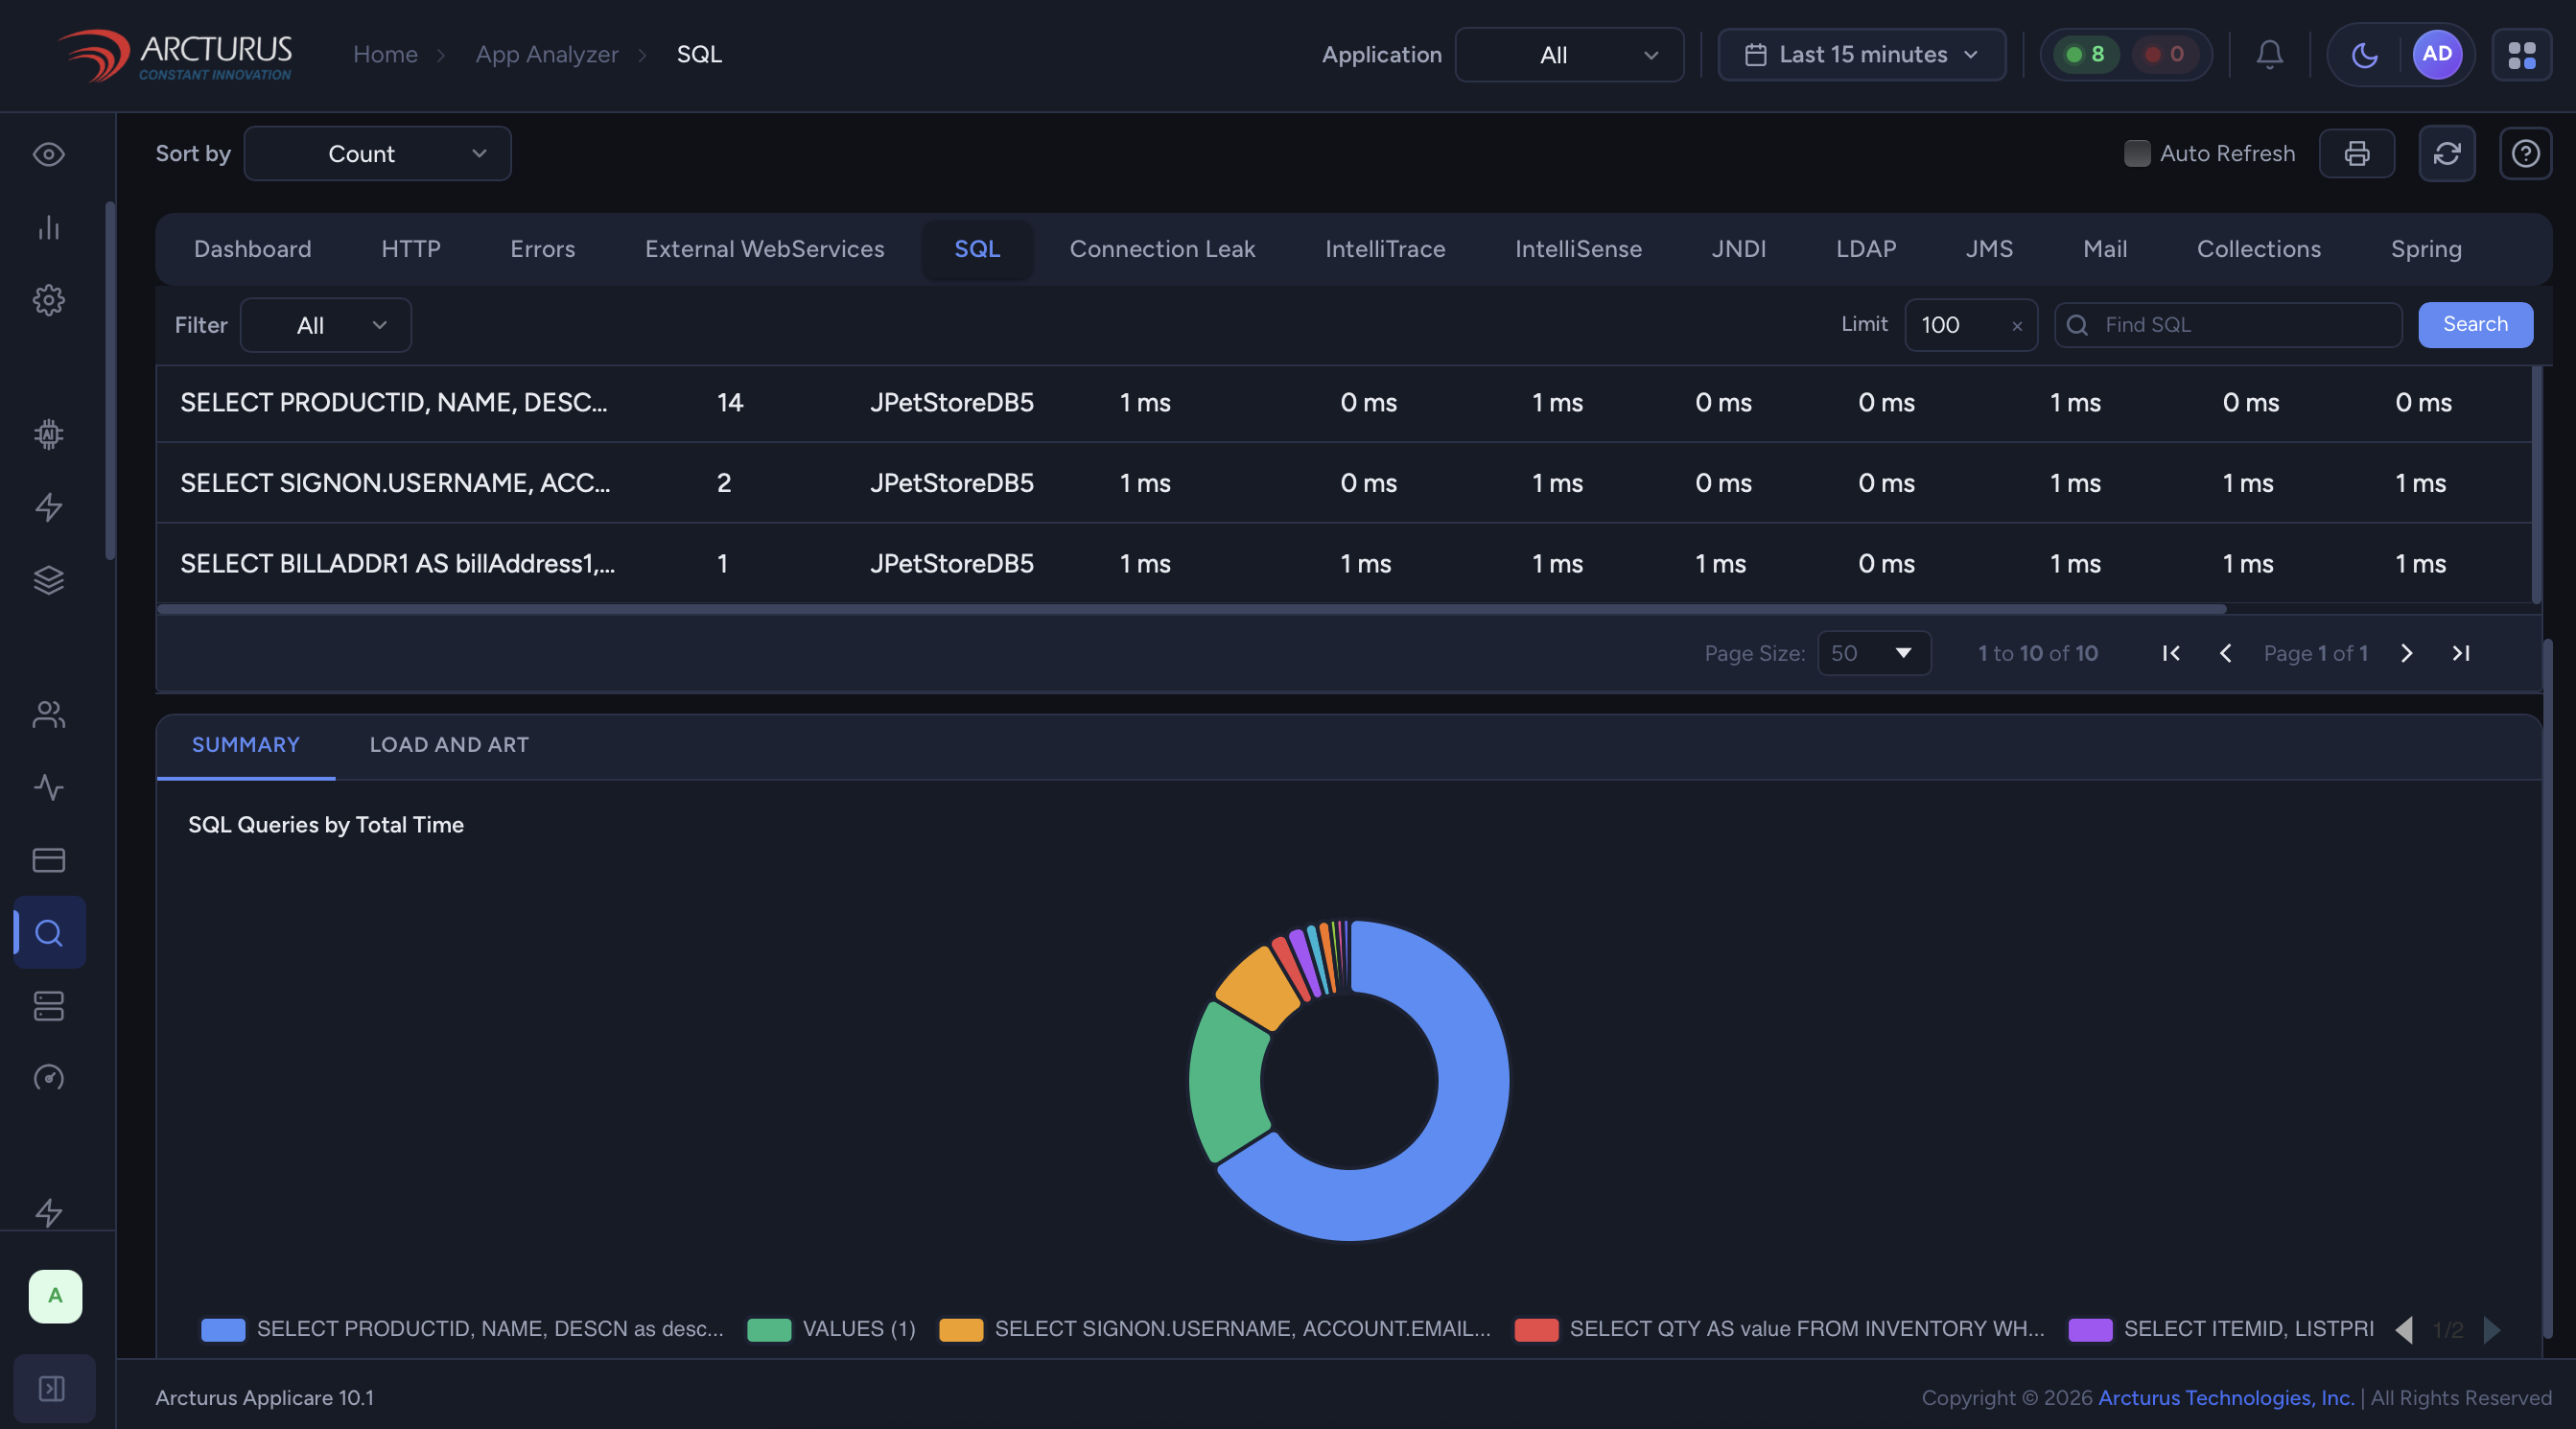
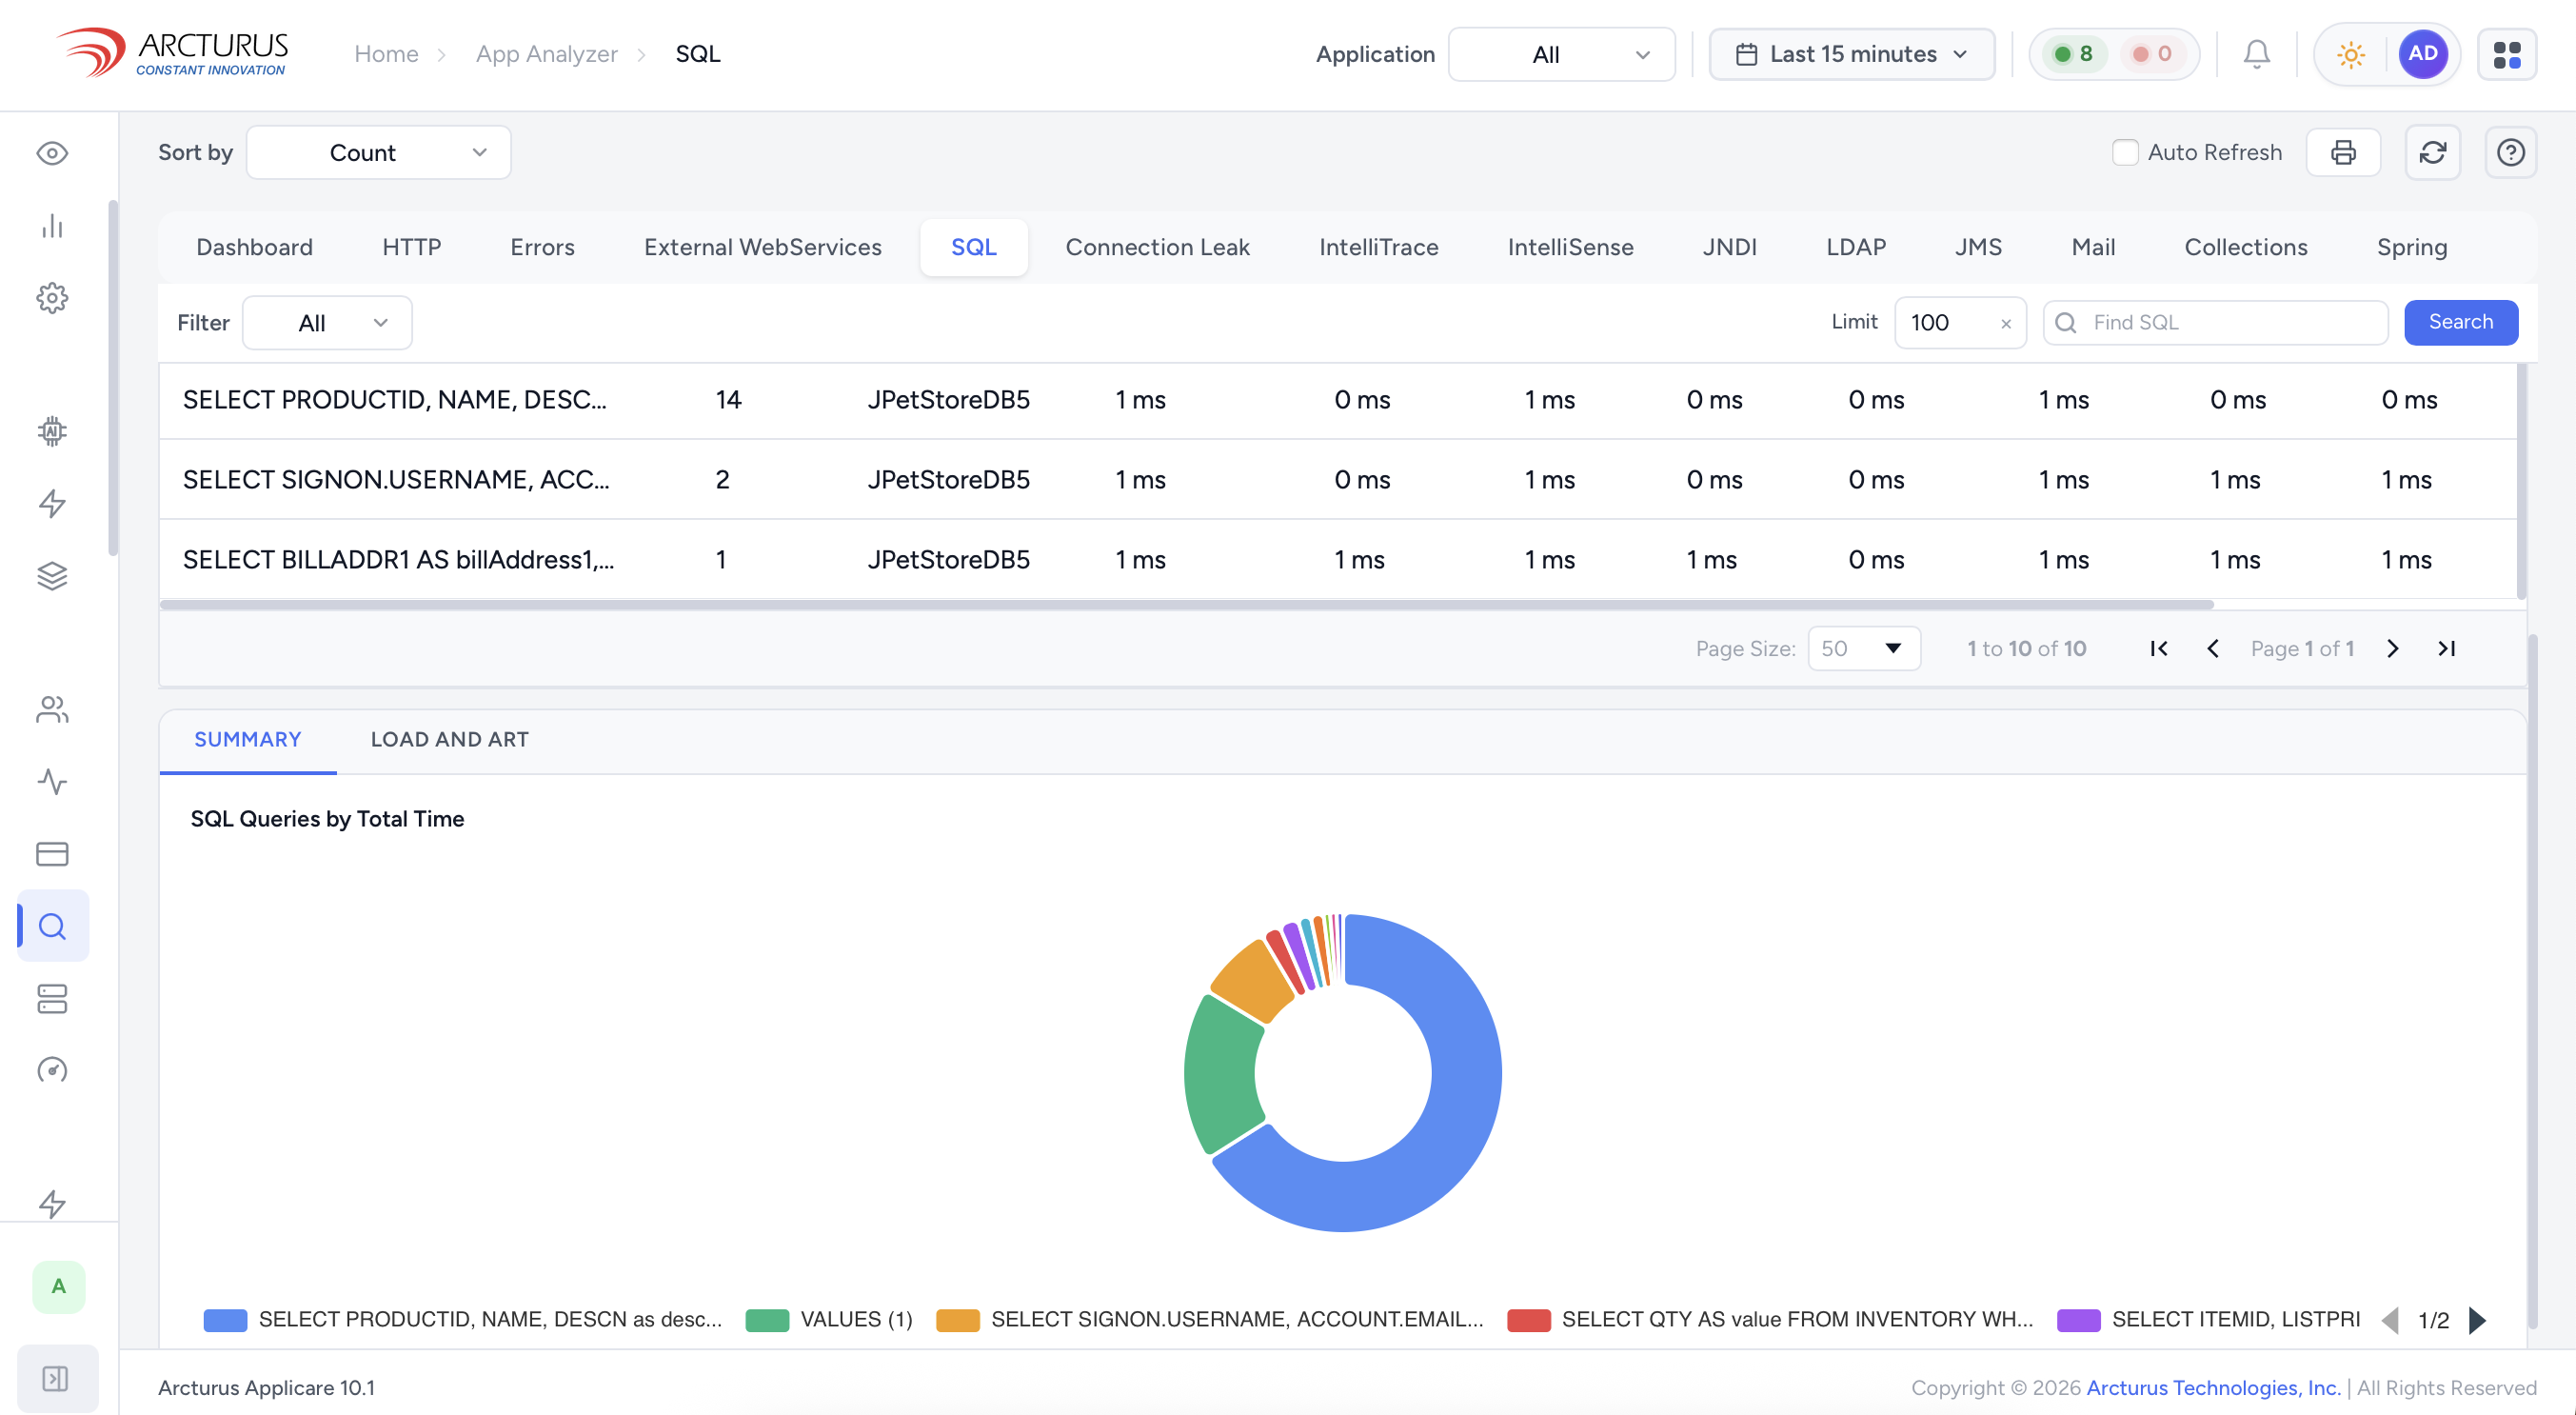
Business transaction visibility
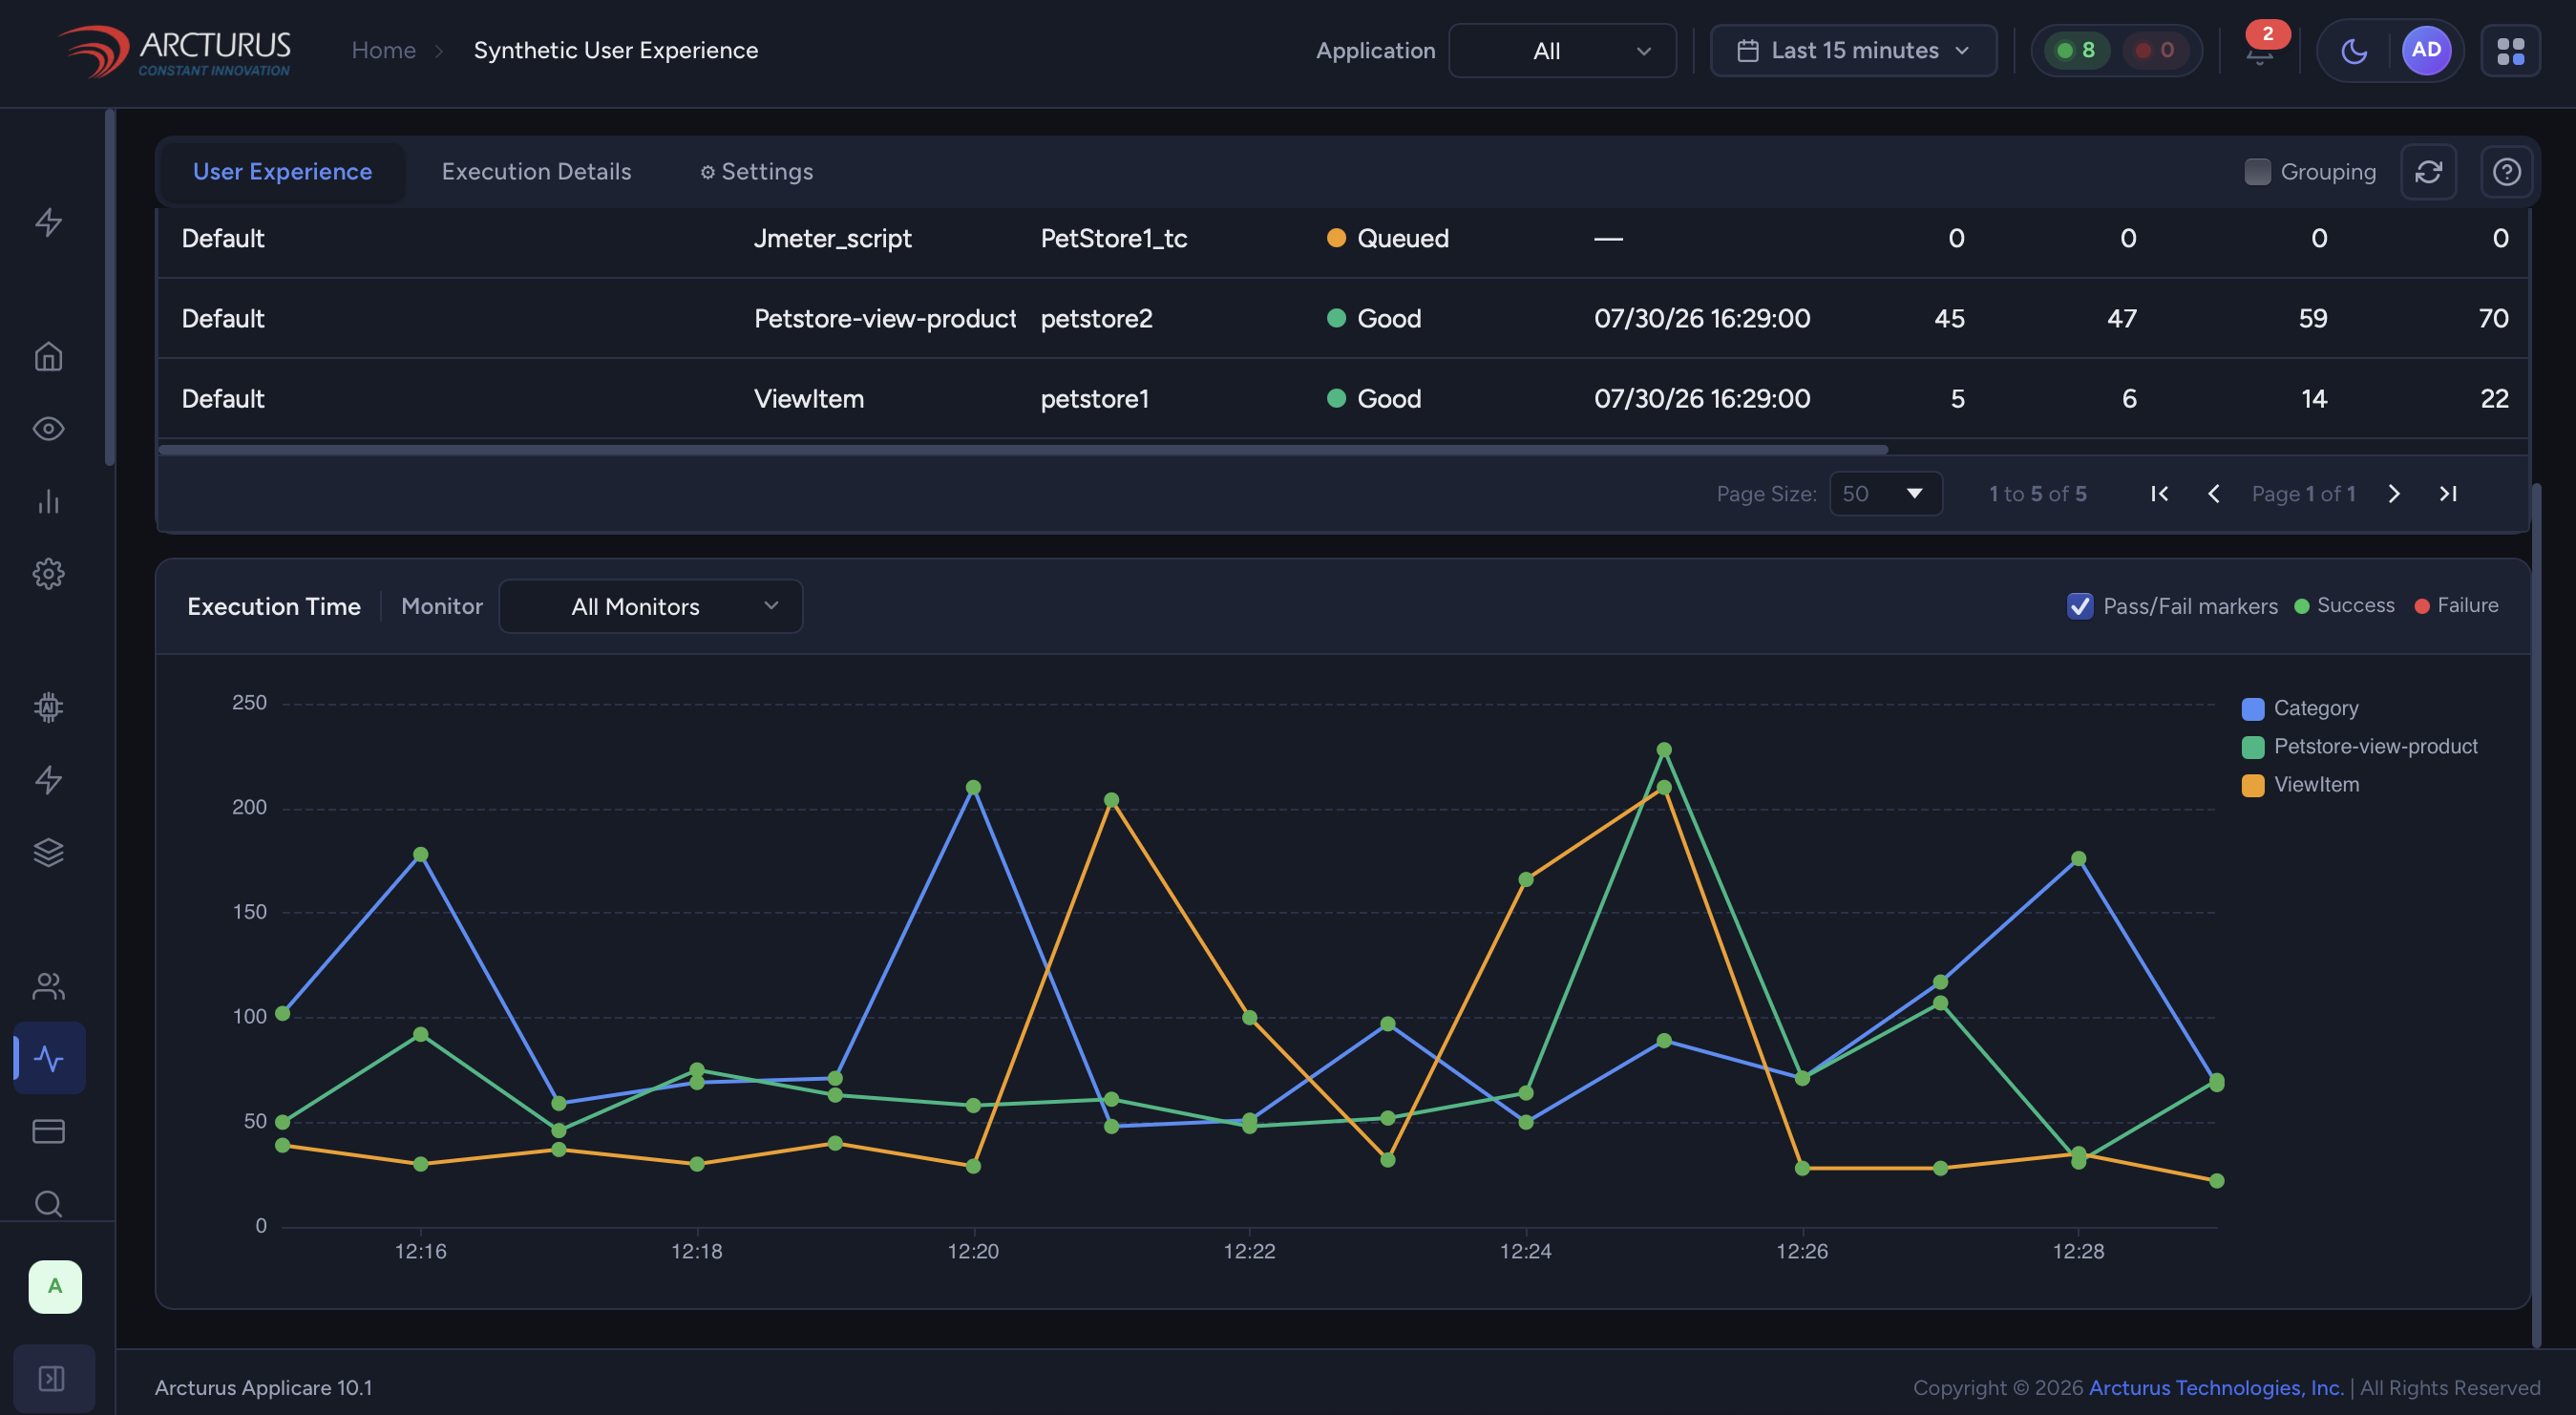
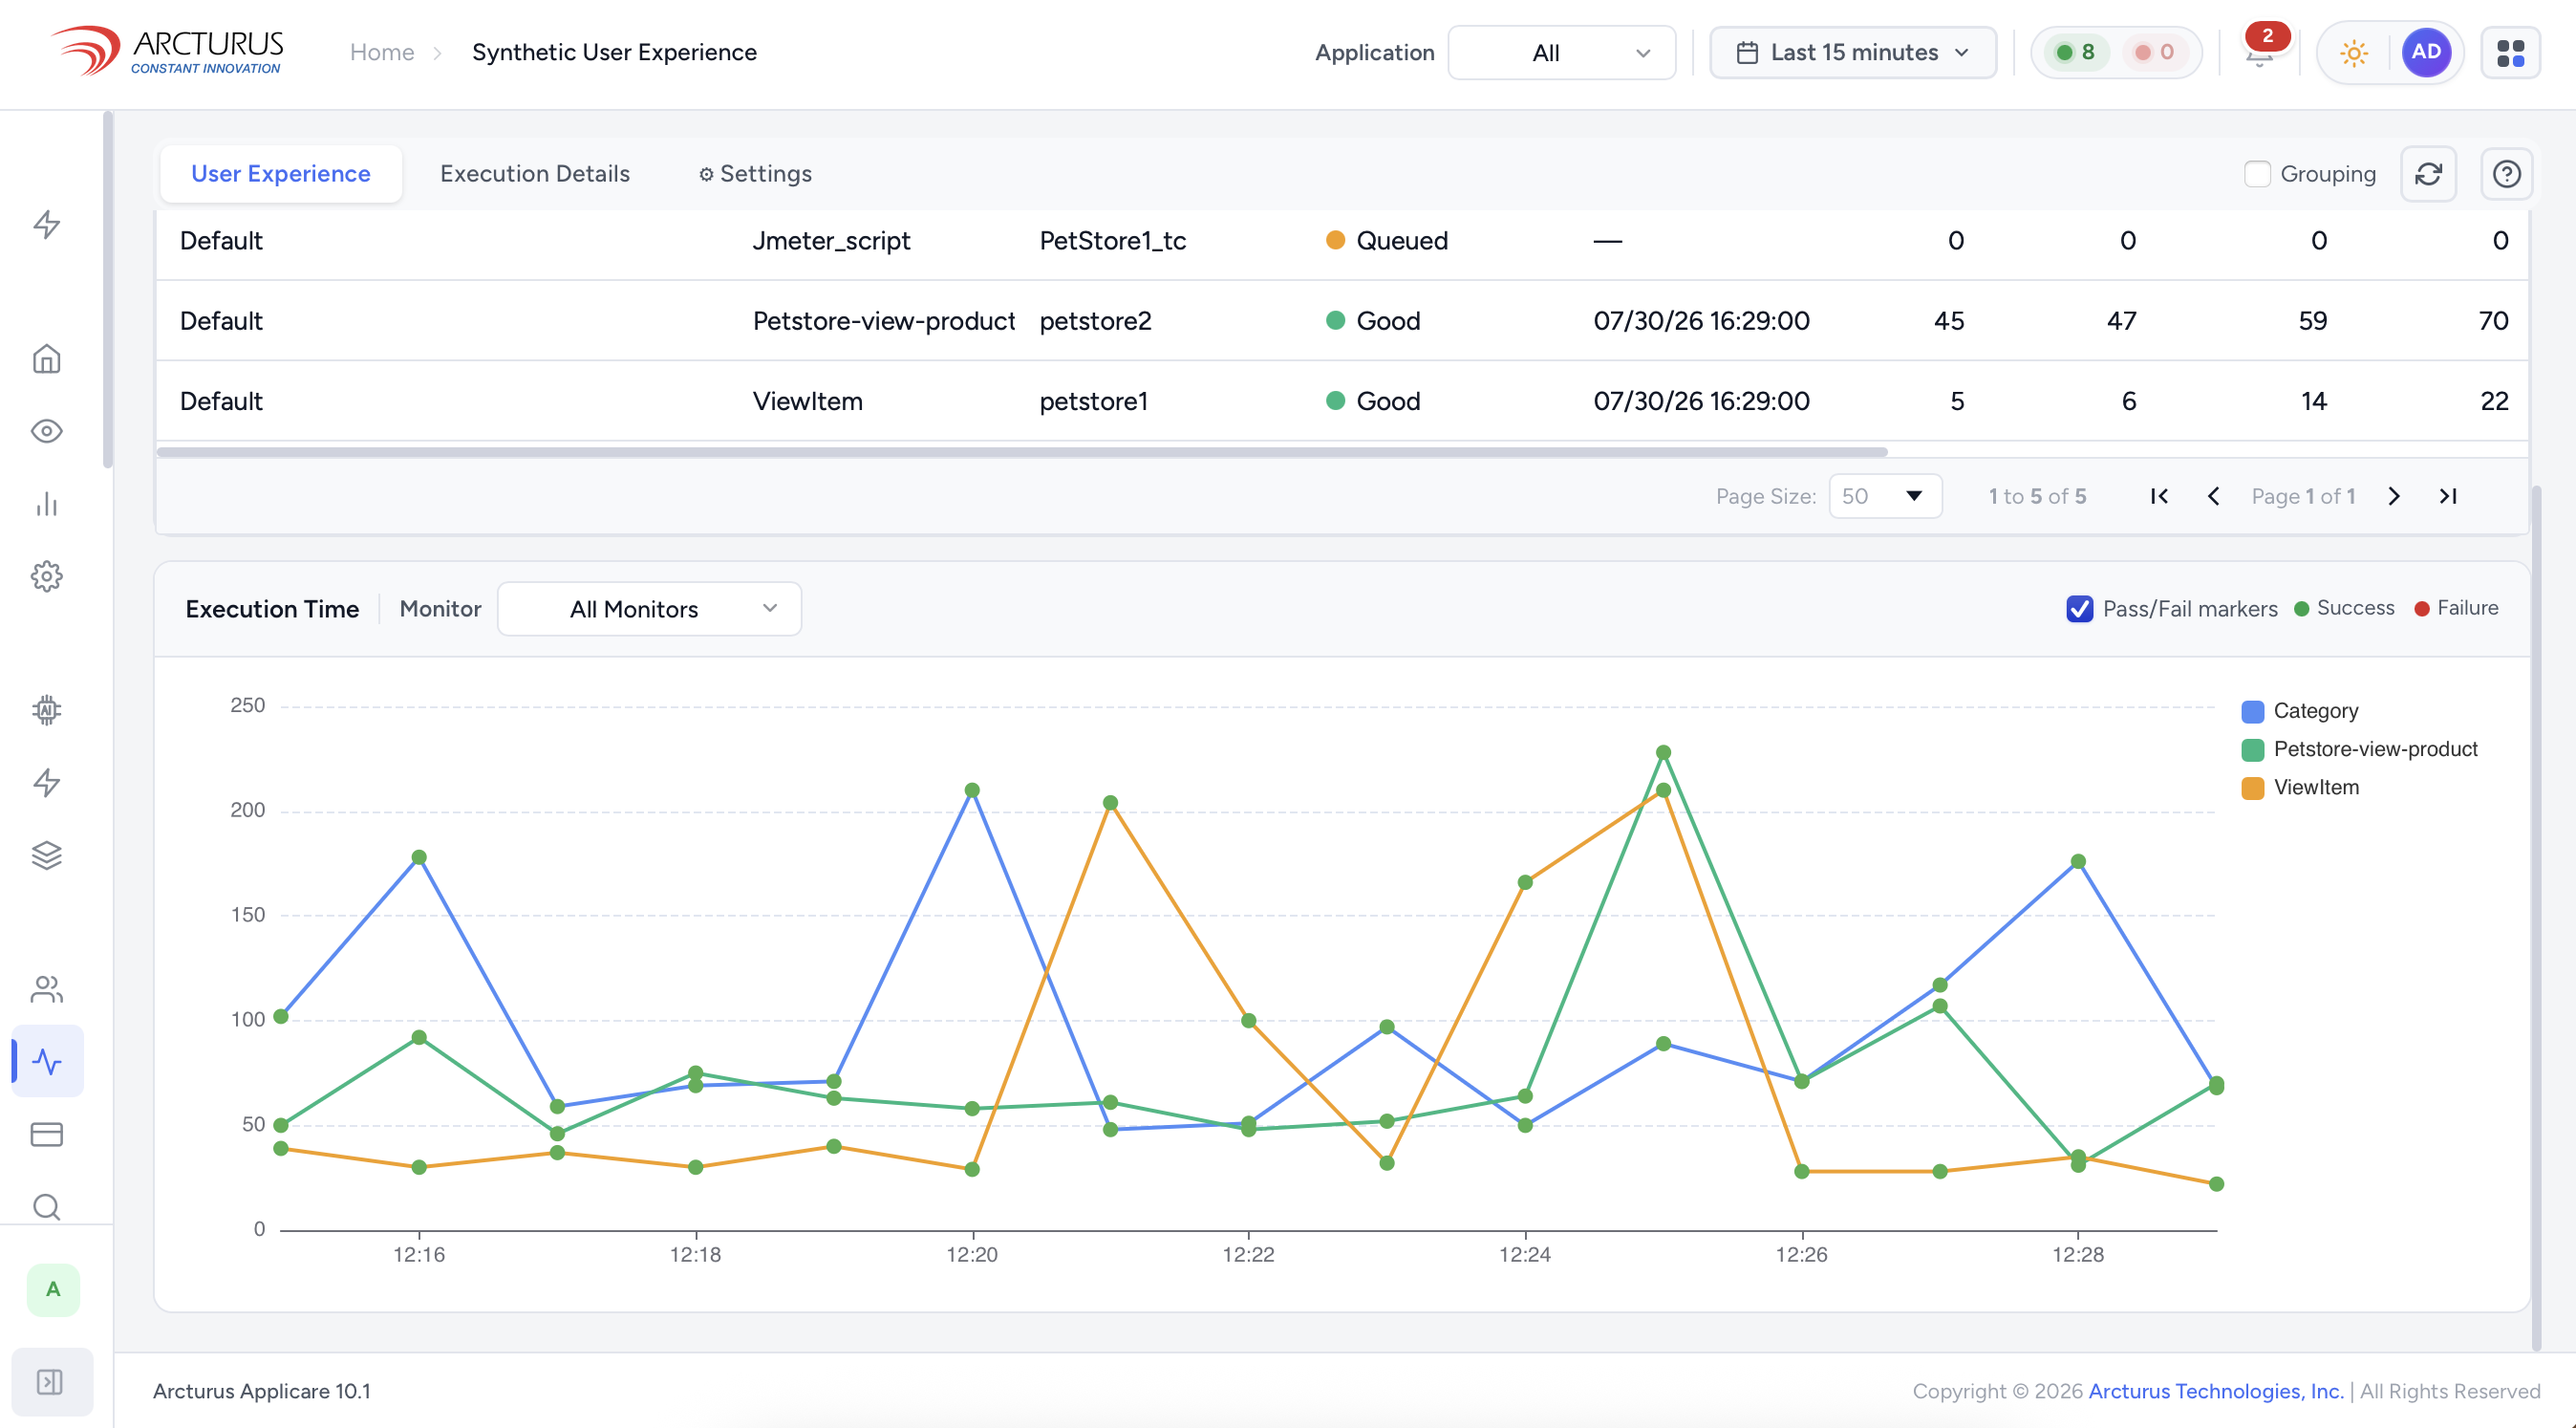
Know which transactions matter — and how they’re performing
Applicare auto-discovers every business transaction — API endpoint, page, and service call — across your cloud environment, with count and response-time breakdowns down to the percentile.
/checkout pages the team before a slow internal health-check ever would.From alert to resolved — automatically.
IntelliTune executes the fix for known failure patterns, with human approval where you want it in the loop.
Three clouds. Three alerts. One root cause.
Full-stack architecture.
From raw telemetry to the tools your team already uses — one continuous pipeline.
What changes when clouds stop fighting each other.
Get started today
See Cloud Monitoring live on your environment
30 minutes. Read-only access. No prep required. We connect to your cloud accounts and show you what Applicare finds — live.
No credit card required · Enterprise observability