The Platform

One causal entity graph. Four AI engines. Built for enterprise engineering teams who need answers, not dashboards.

⬡ Platform overview → ◯ Four engines → ▶ How it works → → Start free trial →

What we solve

Applicare enables teams to observe, automate, and resolve incidents faster across every stack.

★ Customer stories → → Try it free → ◯ Platform overview →
Learn
Blog
Engineering insights & deep dives
Webinars
Live sessions & on-demand recordings
White Papers
Research, architecture guides & reports
Customer Stories
Real teams, real outcomes
Product News
What’s new in Applicare
Adopt & Grow
Applicare University
Free courses for Applicare engineers
Documentation
Guides, APIs & integration docs
About Arcturus
Our mission, story & team
Partners
SI, MSP & technology partners
Community
Slack, GitHub & developer forum
Support
Helpdesk & customer portal
Downloads
Ops Vault
Datasheets, runbooks & toolkits
Featured Case Studies
AeroMexico
Digital ticketing · MTTR 4.5h → 11min
Leading Private Bank
MTTR 3.2h → 18min · first month
Mediclinic
Audit prep 11 weeks → 18 days
NTT DATA
80% on-call page reduction
Danube Group
94% SLO compliance
ONP
0 violations at last audit
Seygen
78% downtime reduction · GxP compliance
Insurance Tech Platform
67% P1 reduction · $2.4M saved
IIS & Server Availability
100% SLA report accuracy
Health Check Offering
4.2x ROI · 48hr delivery
Bank of Muscat
99.95% core banking uptime
By Industry
Financial Services
Airlines & Transport
Healthcare
Government
Retail & E-Commerce
Pharmaceuticals
Insurance Technology
Managed Services
Enterprise IT
Professional Services
HomePlatformSolutionsArcIn AIResourcesCustomers Login Book a Demo
Solutions · AWS Incident Intelligence

Understand every AWS incident in under 60 seconds.

From EC2 and EKS to Lambda, RDS, and customer transactions, Applicare unifies AWS observability into one causal entity graph — pinpointing root cause, quantifying customer impact, and recommending AI-driven remediation before incidents become outages.
Applicare — AWS Incident Intelligence⬤ Live
Applicare AWS dashboard
<60s
Root cause across the full AWS stack
38%
Average AWS cost reduction after deployment
30+
AWS services monitored natively
99.99%
Application availability for Applicare customers
The Observability Gap

CloudWatch tells you a metric moved.
Applicare tells you why.

Native AWS monitoring surfaces signals across hundreds of dashboards. Applicare delivers causality — what changed, why it happened, which services are affected, how customers are impacted, and what to do next.

CloudWatch tells you
  • CPU / memory is high
  • Lambda errors increased
  • RDS latency is rising
You still have to find why — hours of manual correlation across CloudWatch, X-Ray, logs, and teams.
Applicare tells you
  • What changed (deploy, scaling, config drift)
  • Why it happened (root cause service & query)
  • Which services are affected and in what order
  • How customers are impacted — and what to do next
Causality, business impact, and remediation — in under 60 seconds.
SIGNALS
Metrics · Logs · Traces
CONTEXT
Deploys · Changes
CAUSALITY
Root Cause · Impact
ACTION
Remediation Steps
See it in action

Your entire AWS estate, in one console.

Compute, databases, containers, networking, and transactions — correlated, not scattered across CloudWatch tabs.
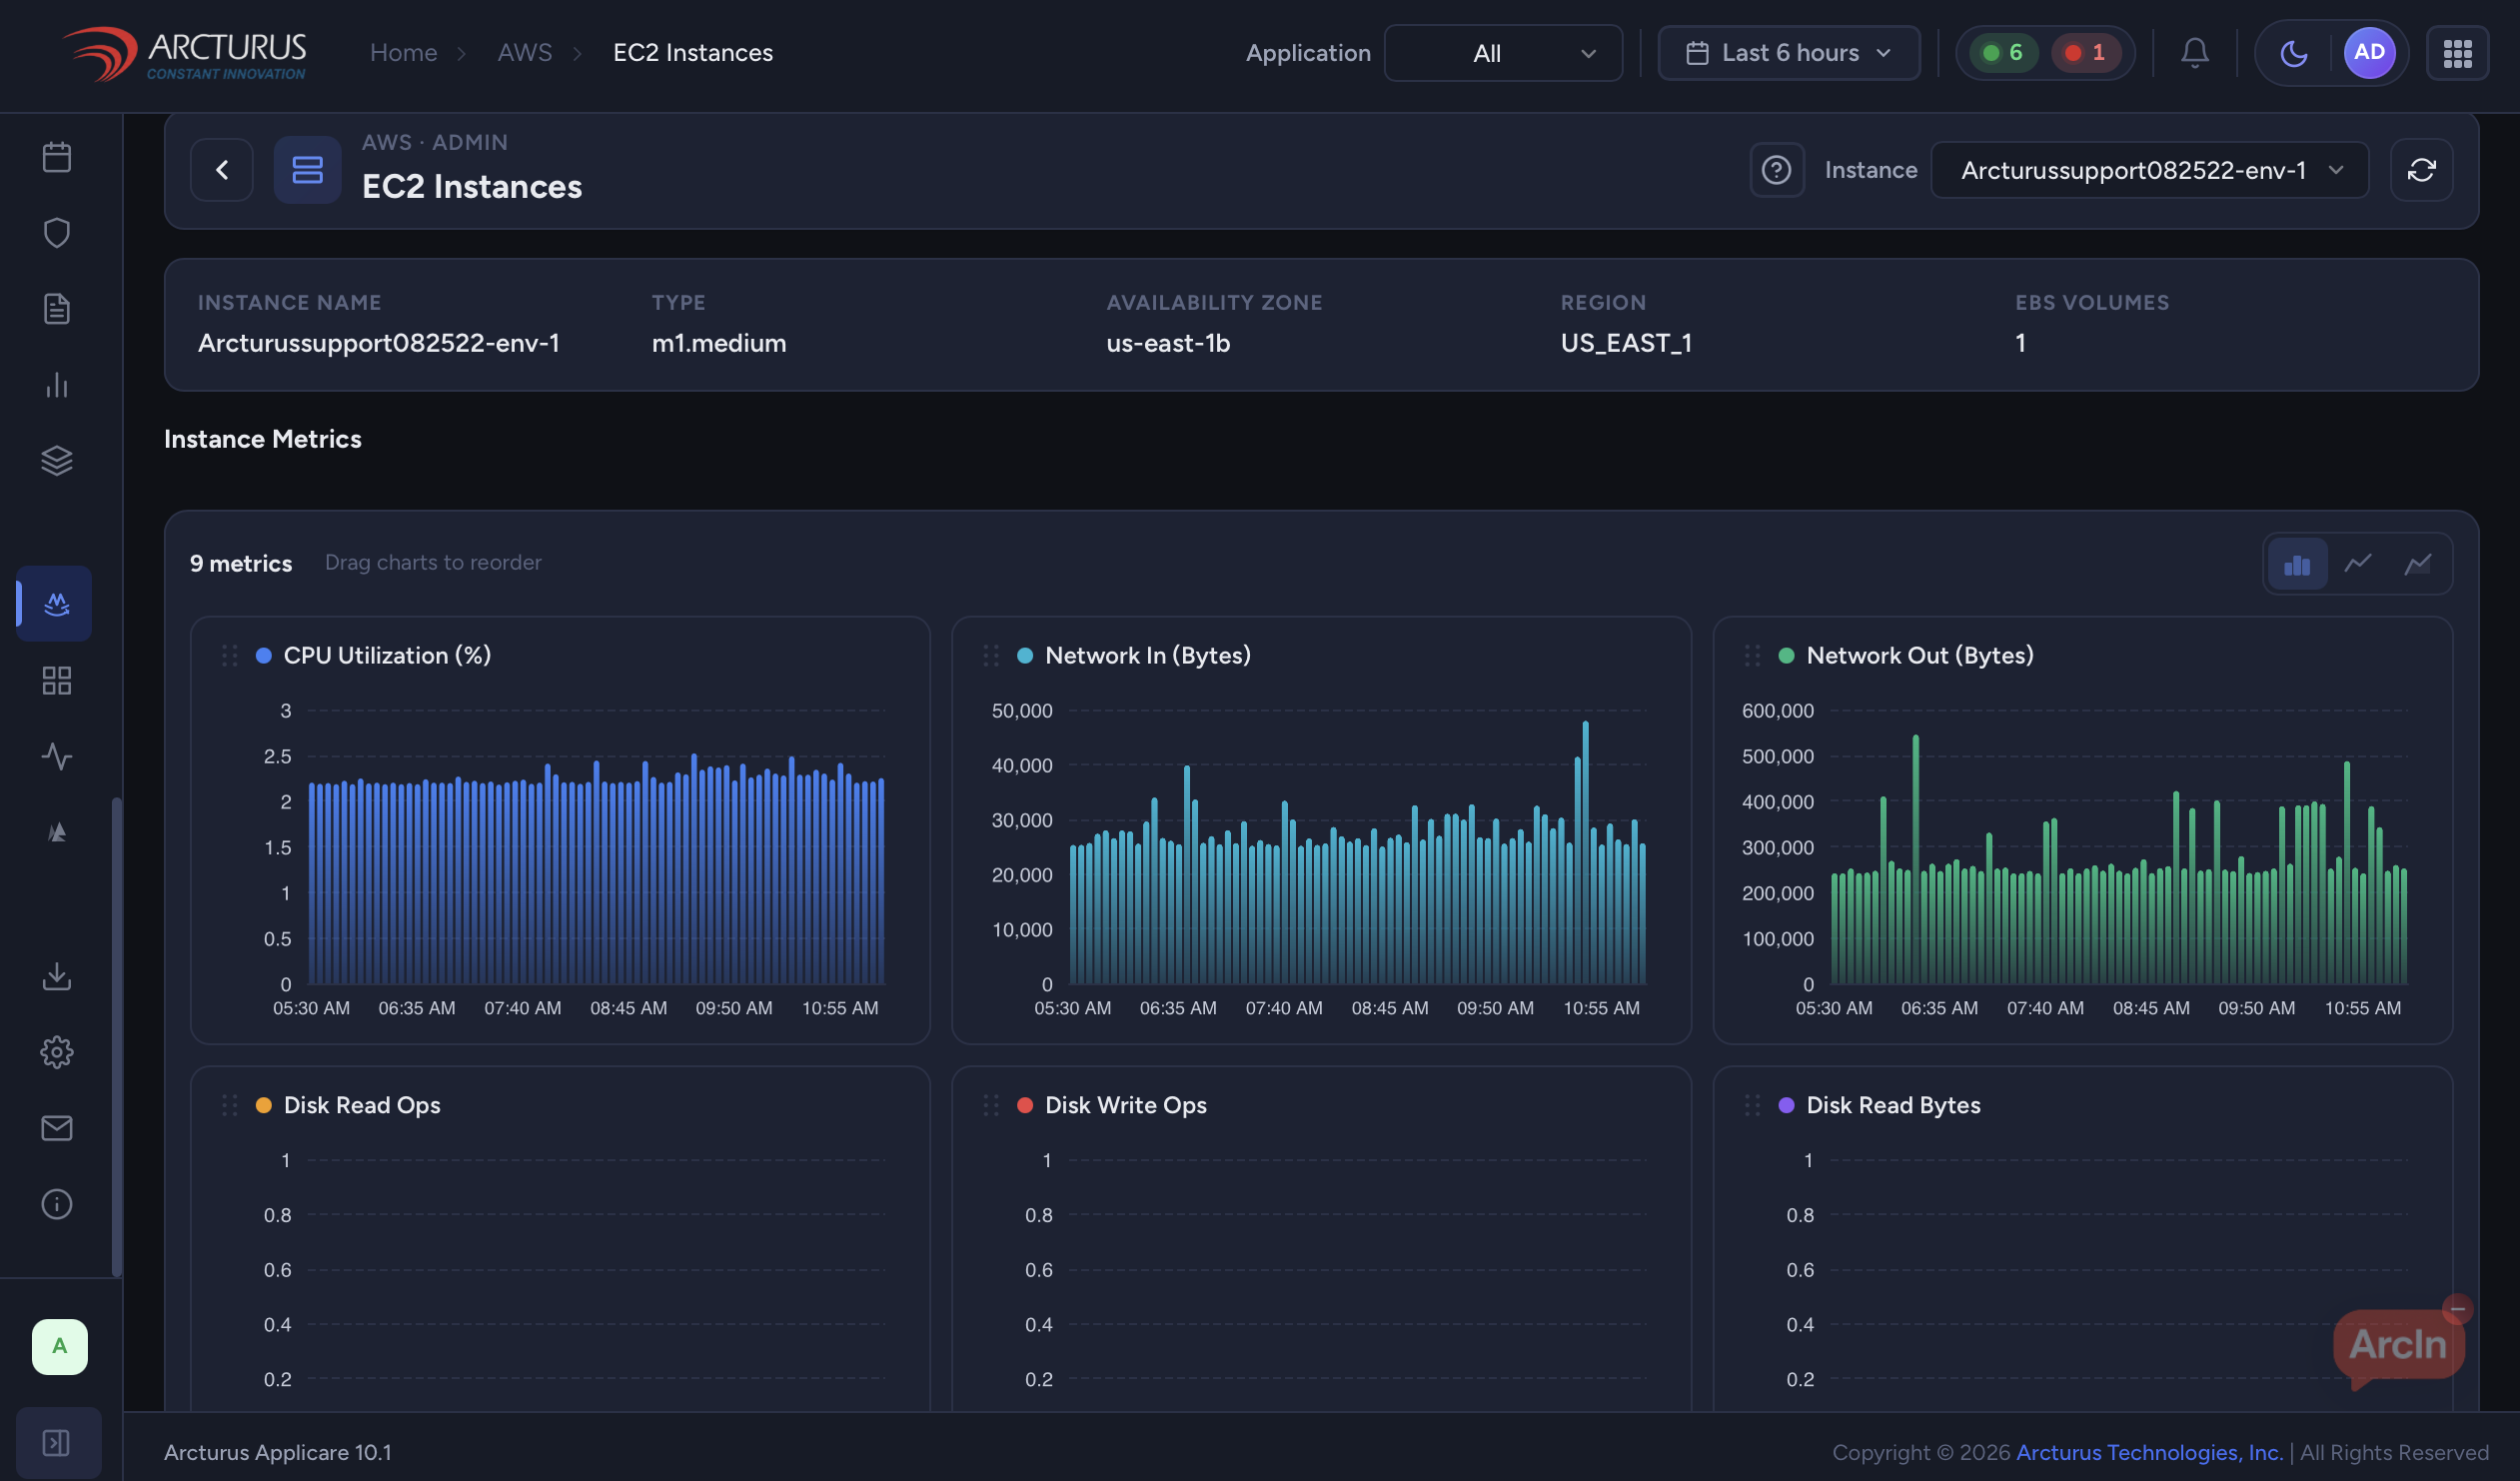
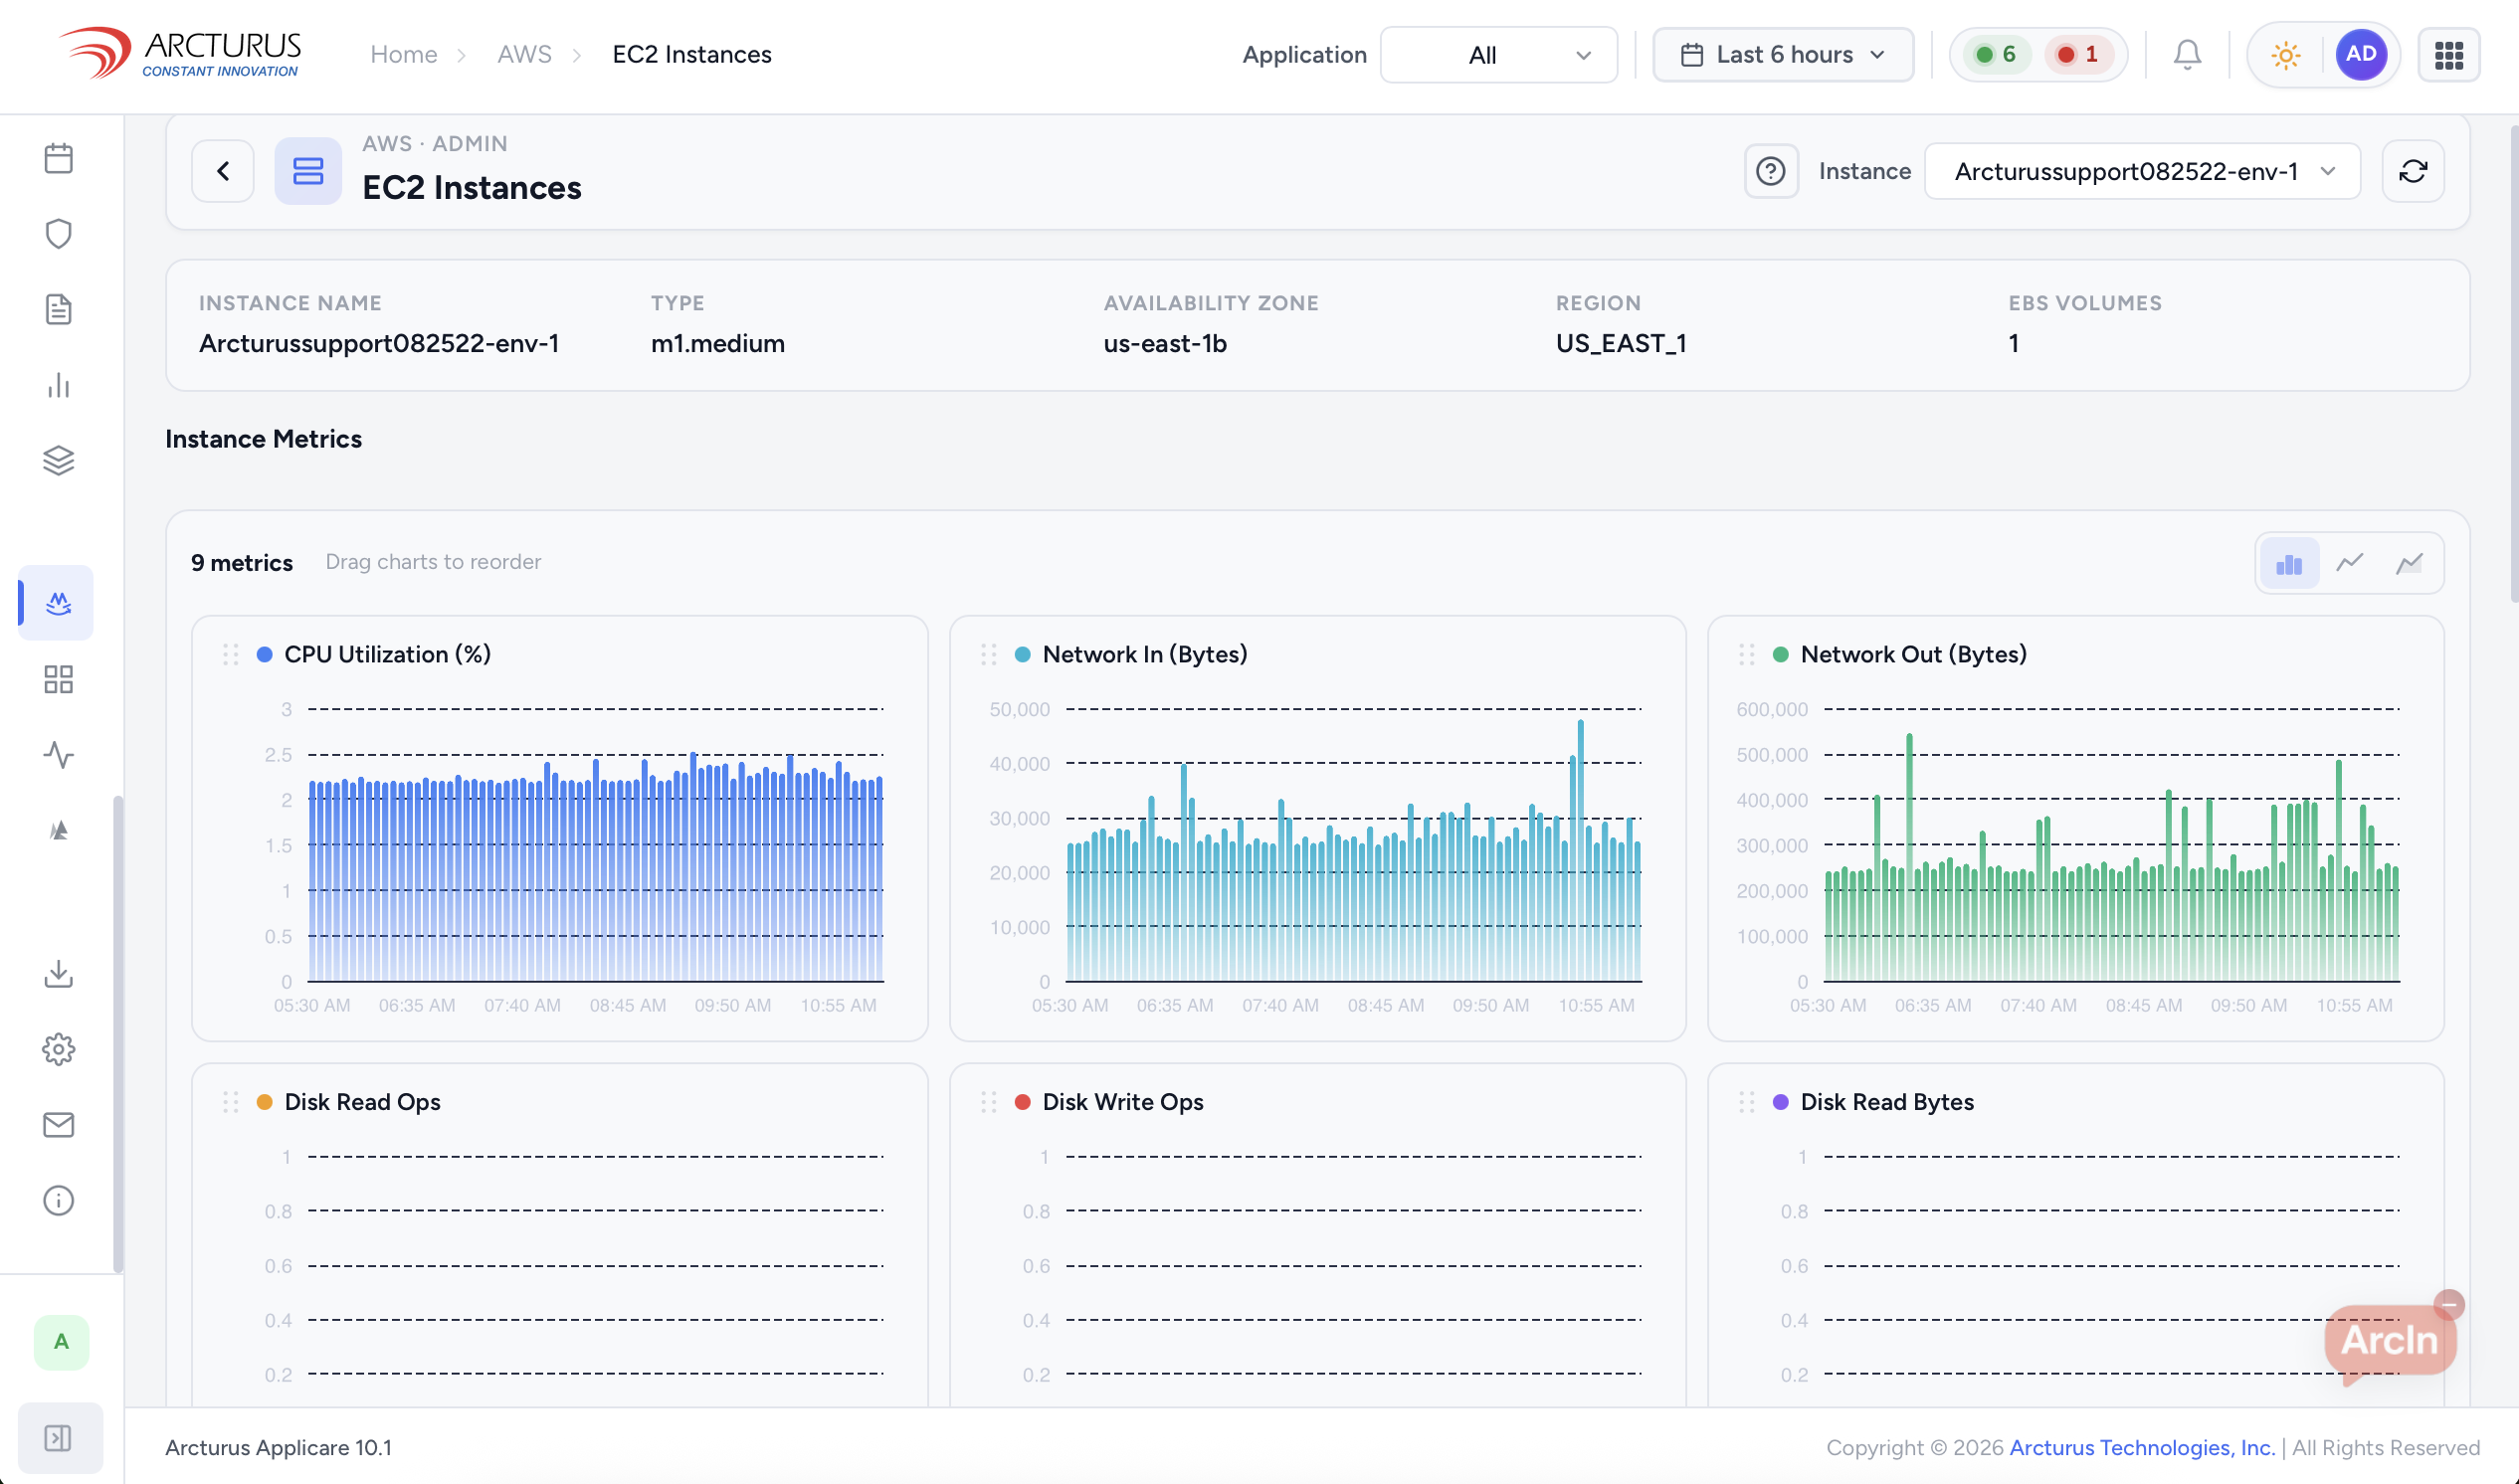
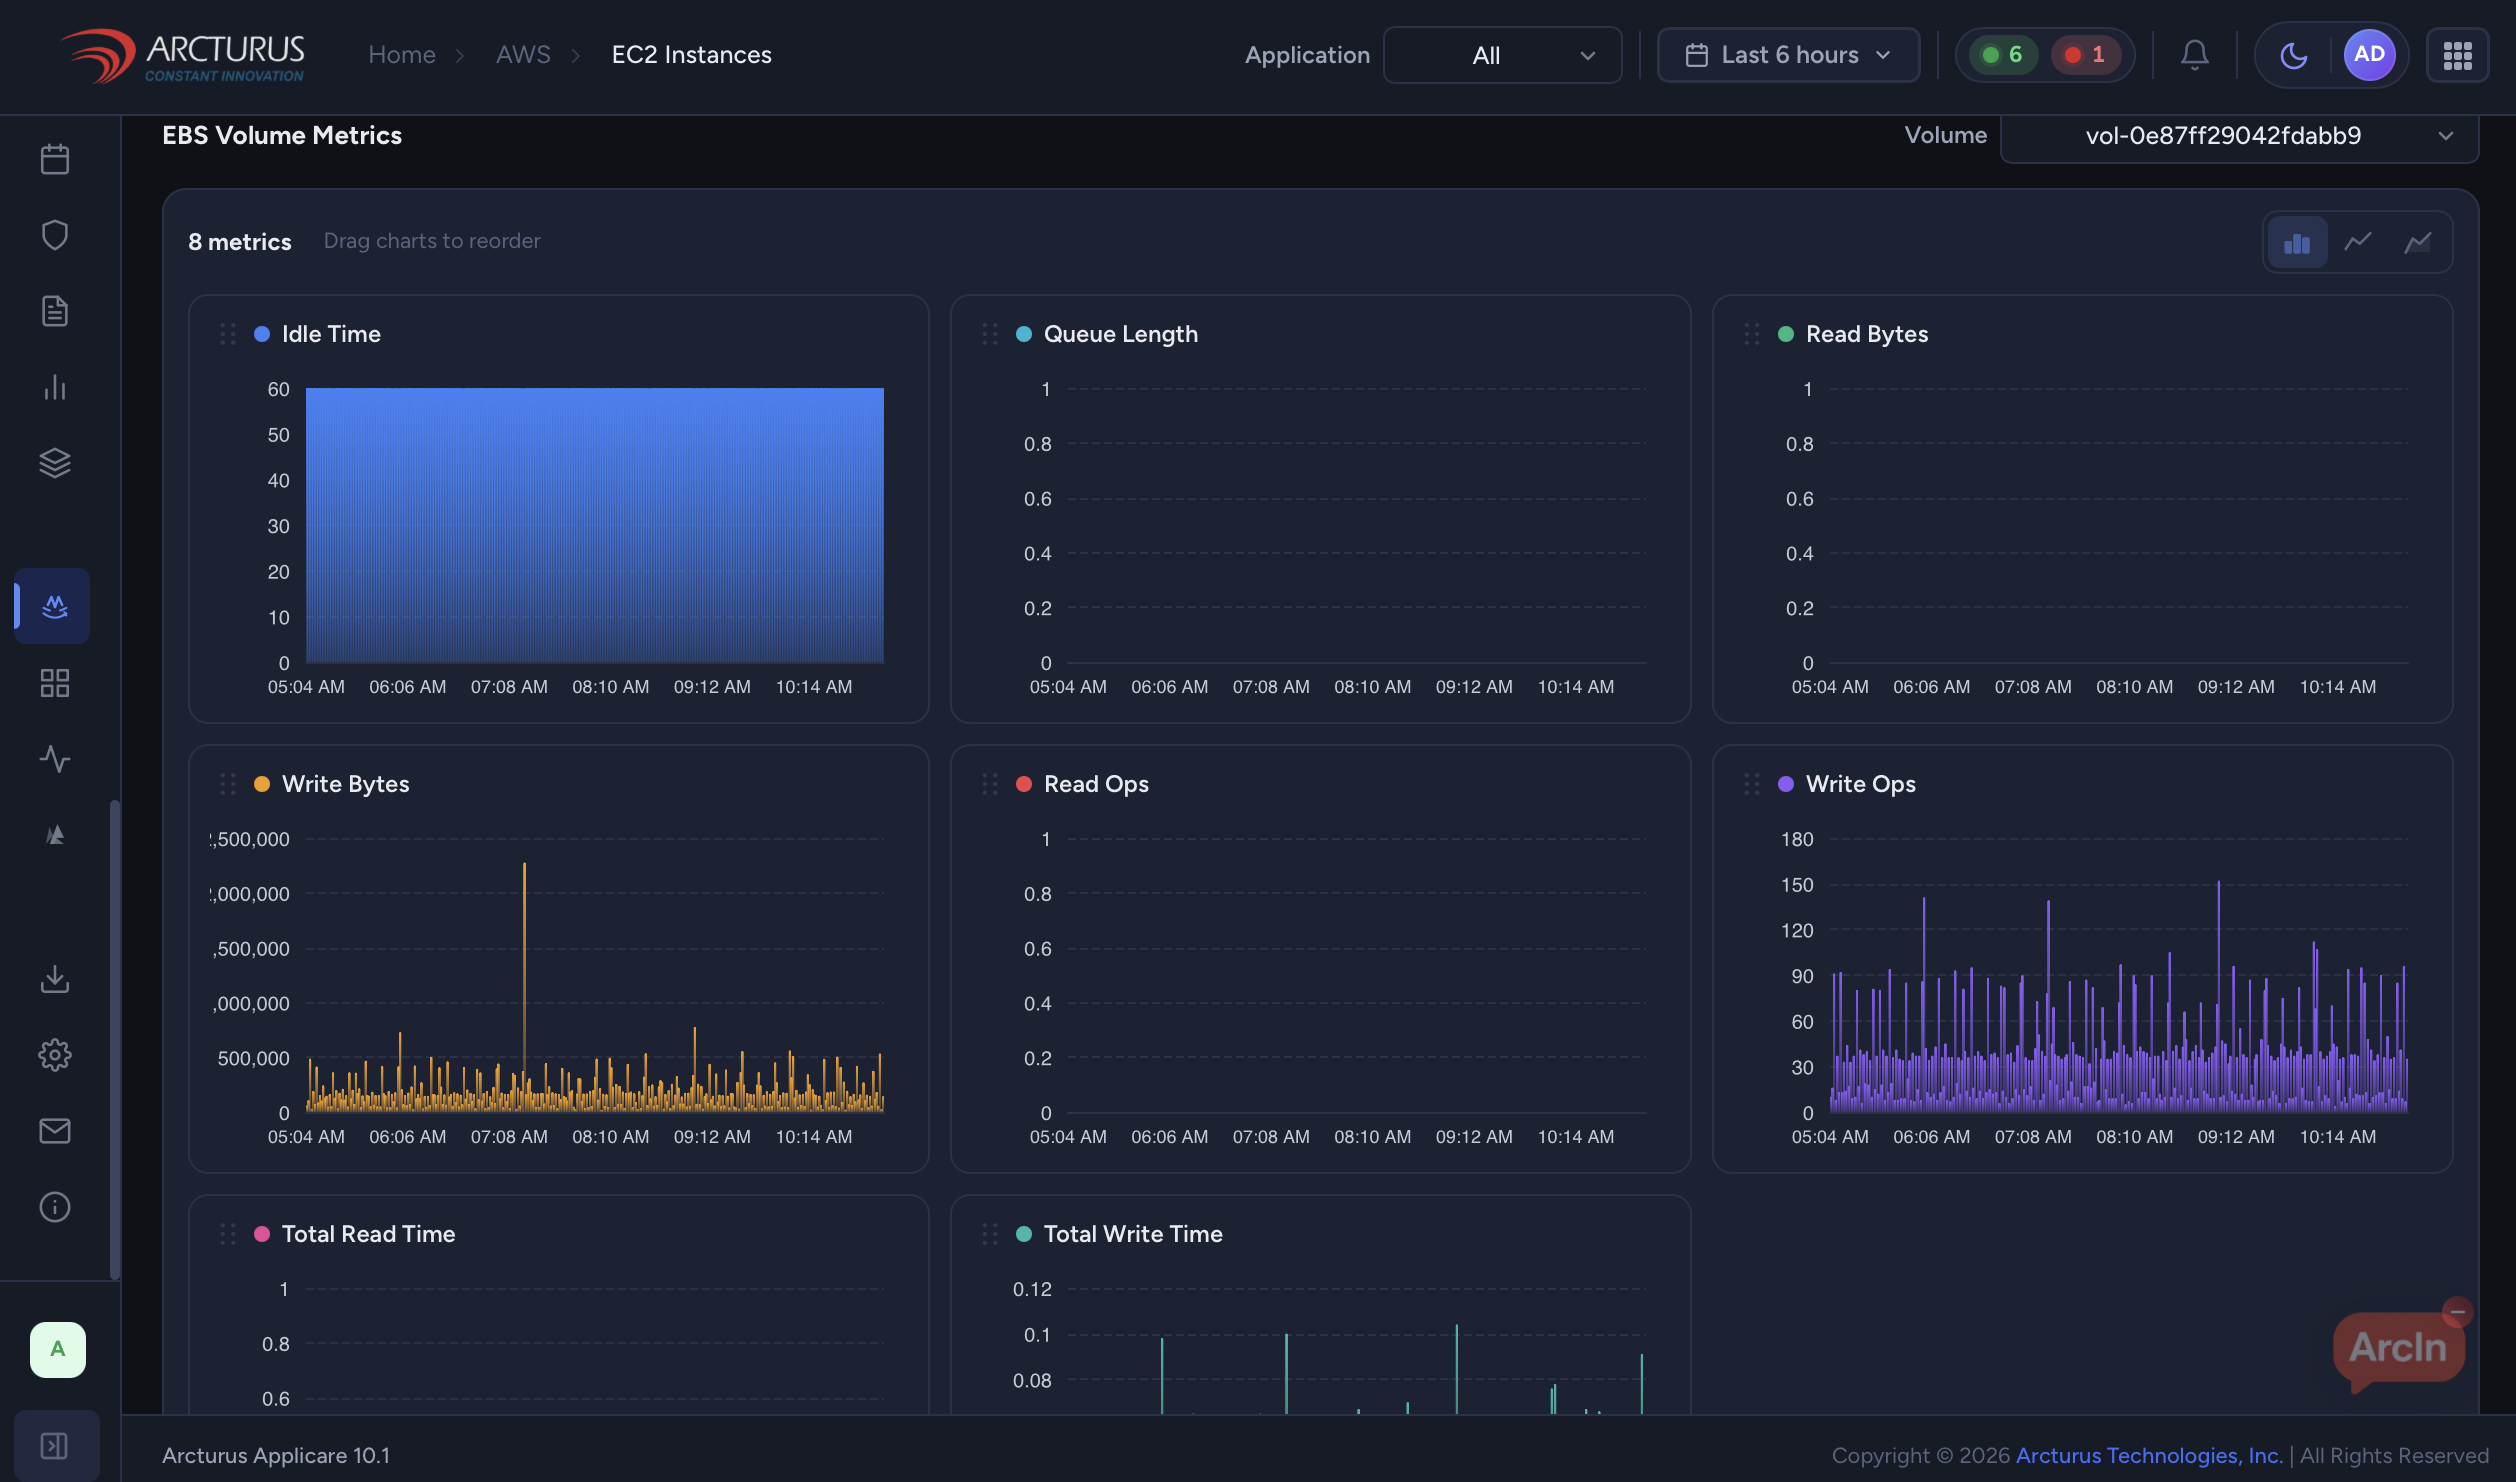
EC2 instance metricsEC2 instance metrics
EC2 & compute health
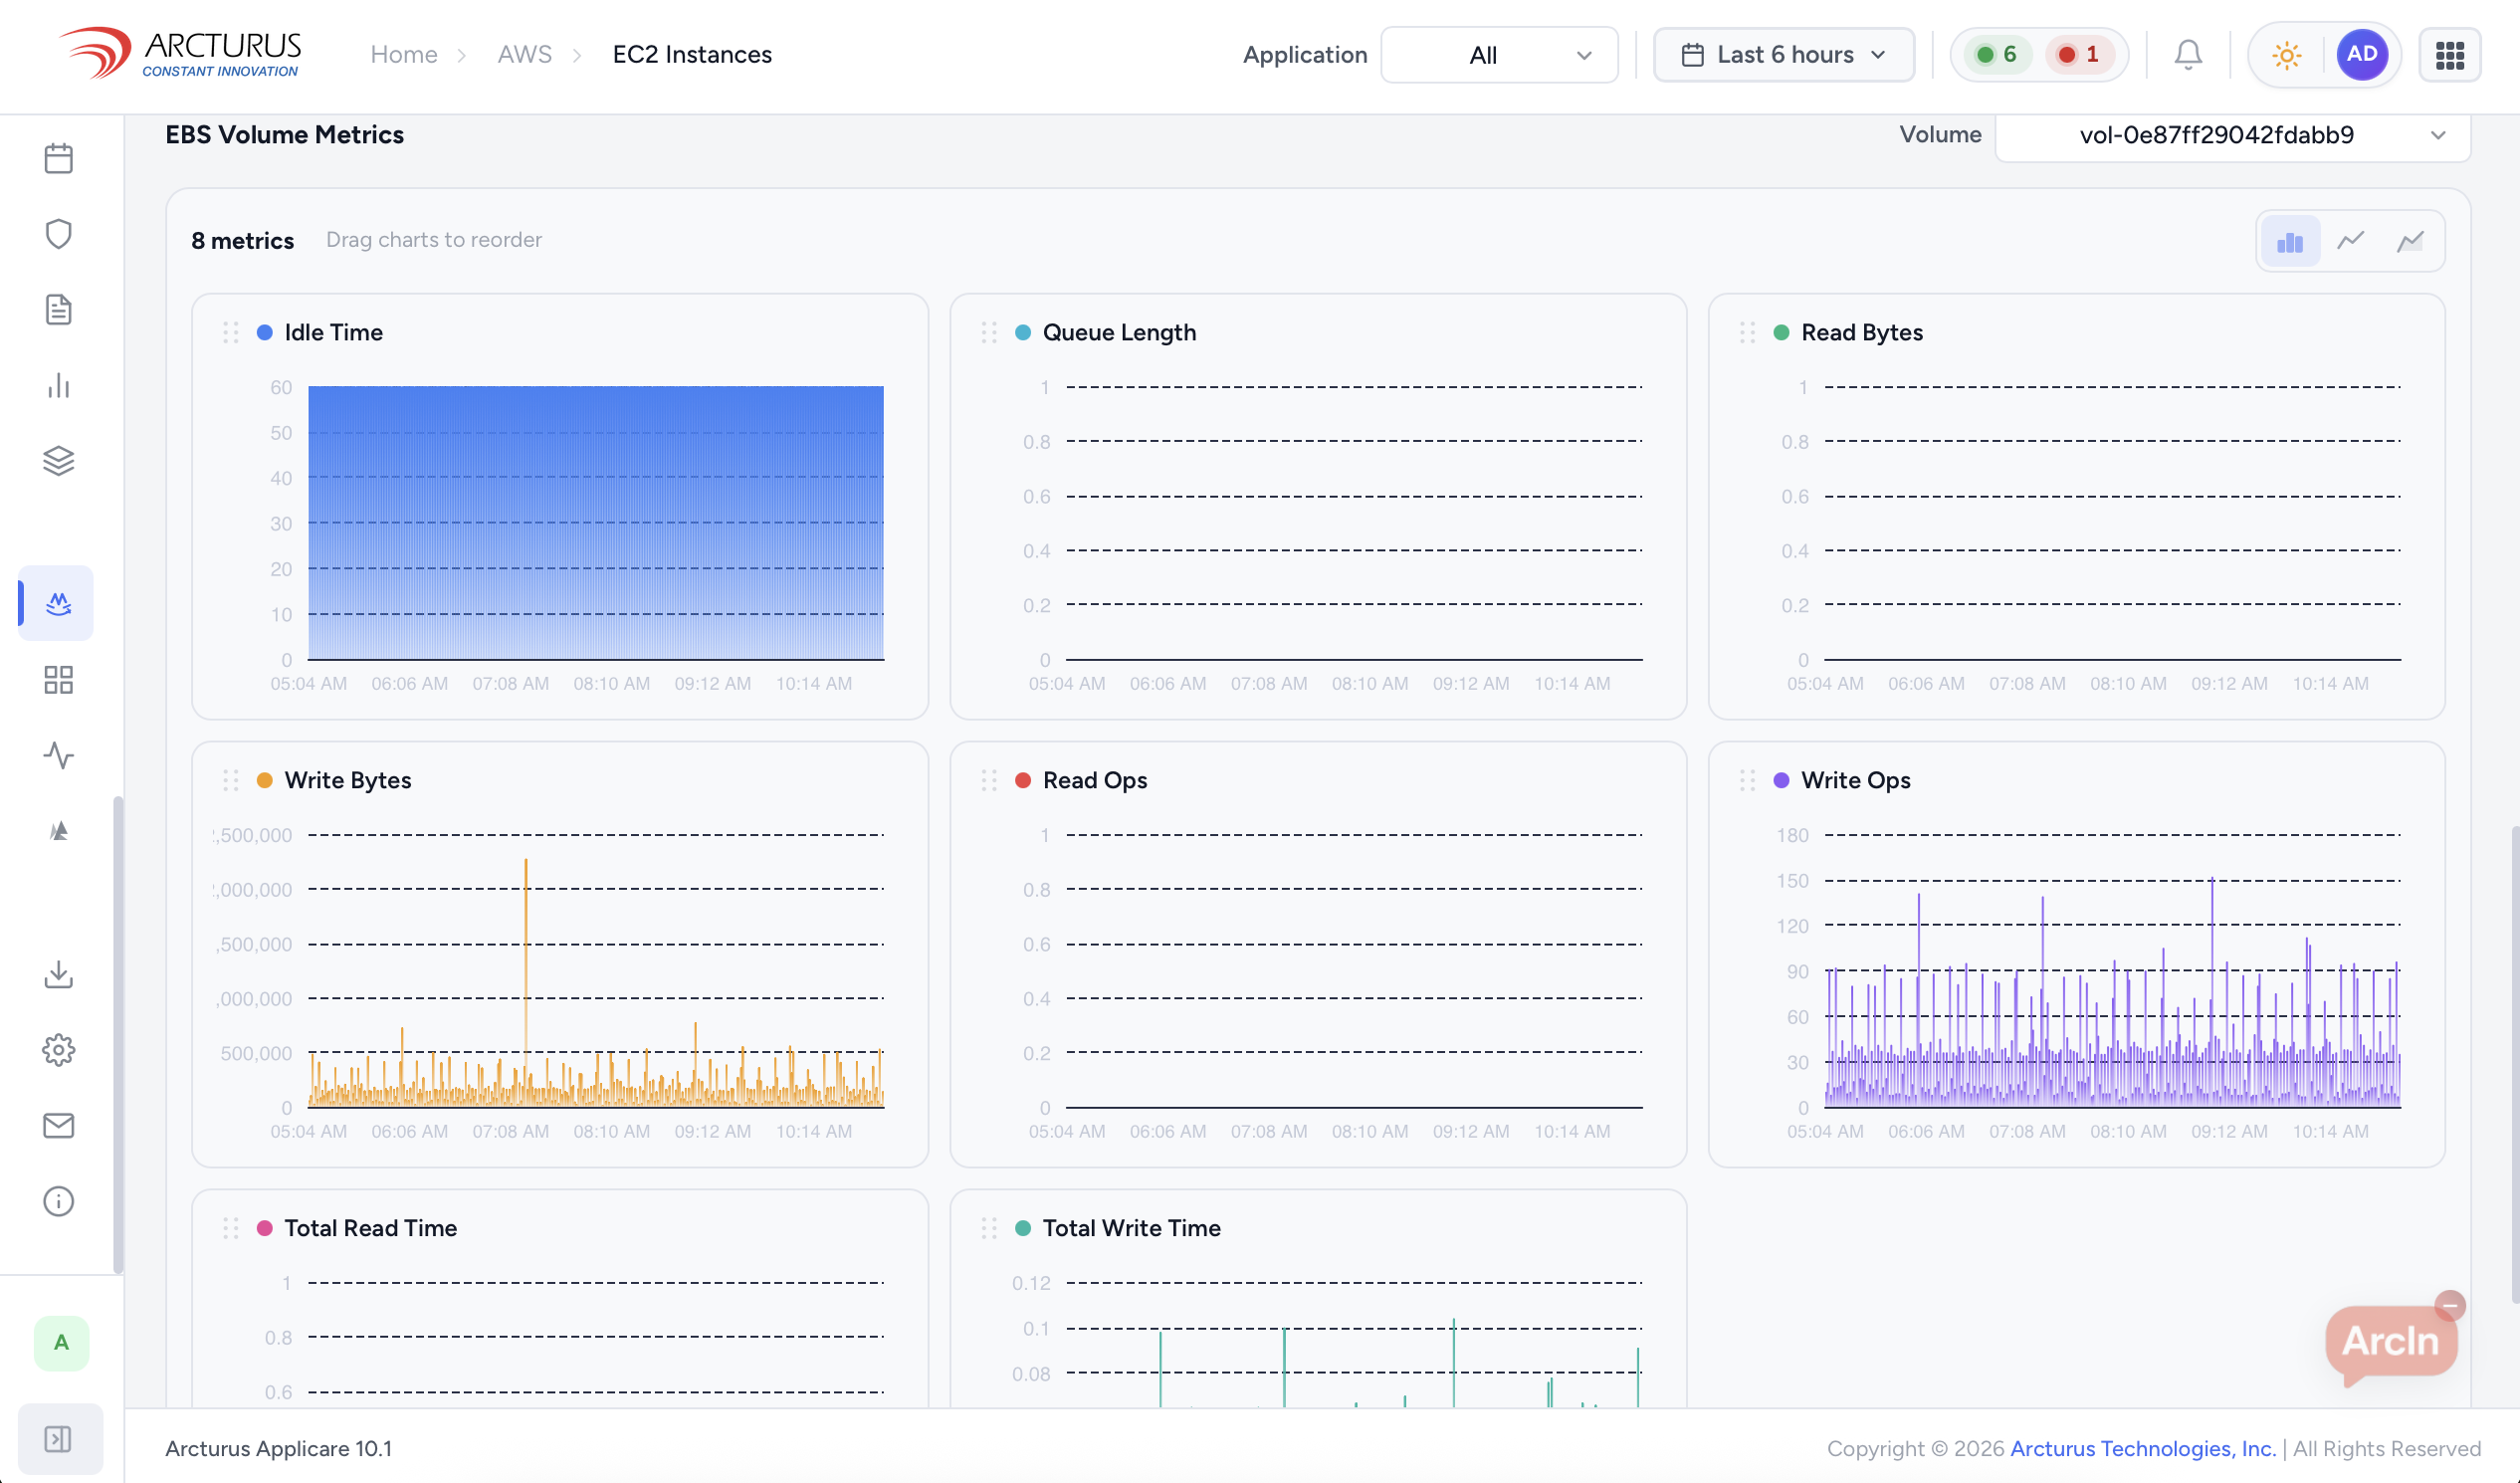
EBS volume metricsEBS volume metrics
EBS volume metrics
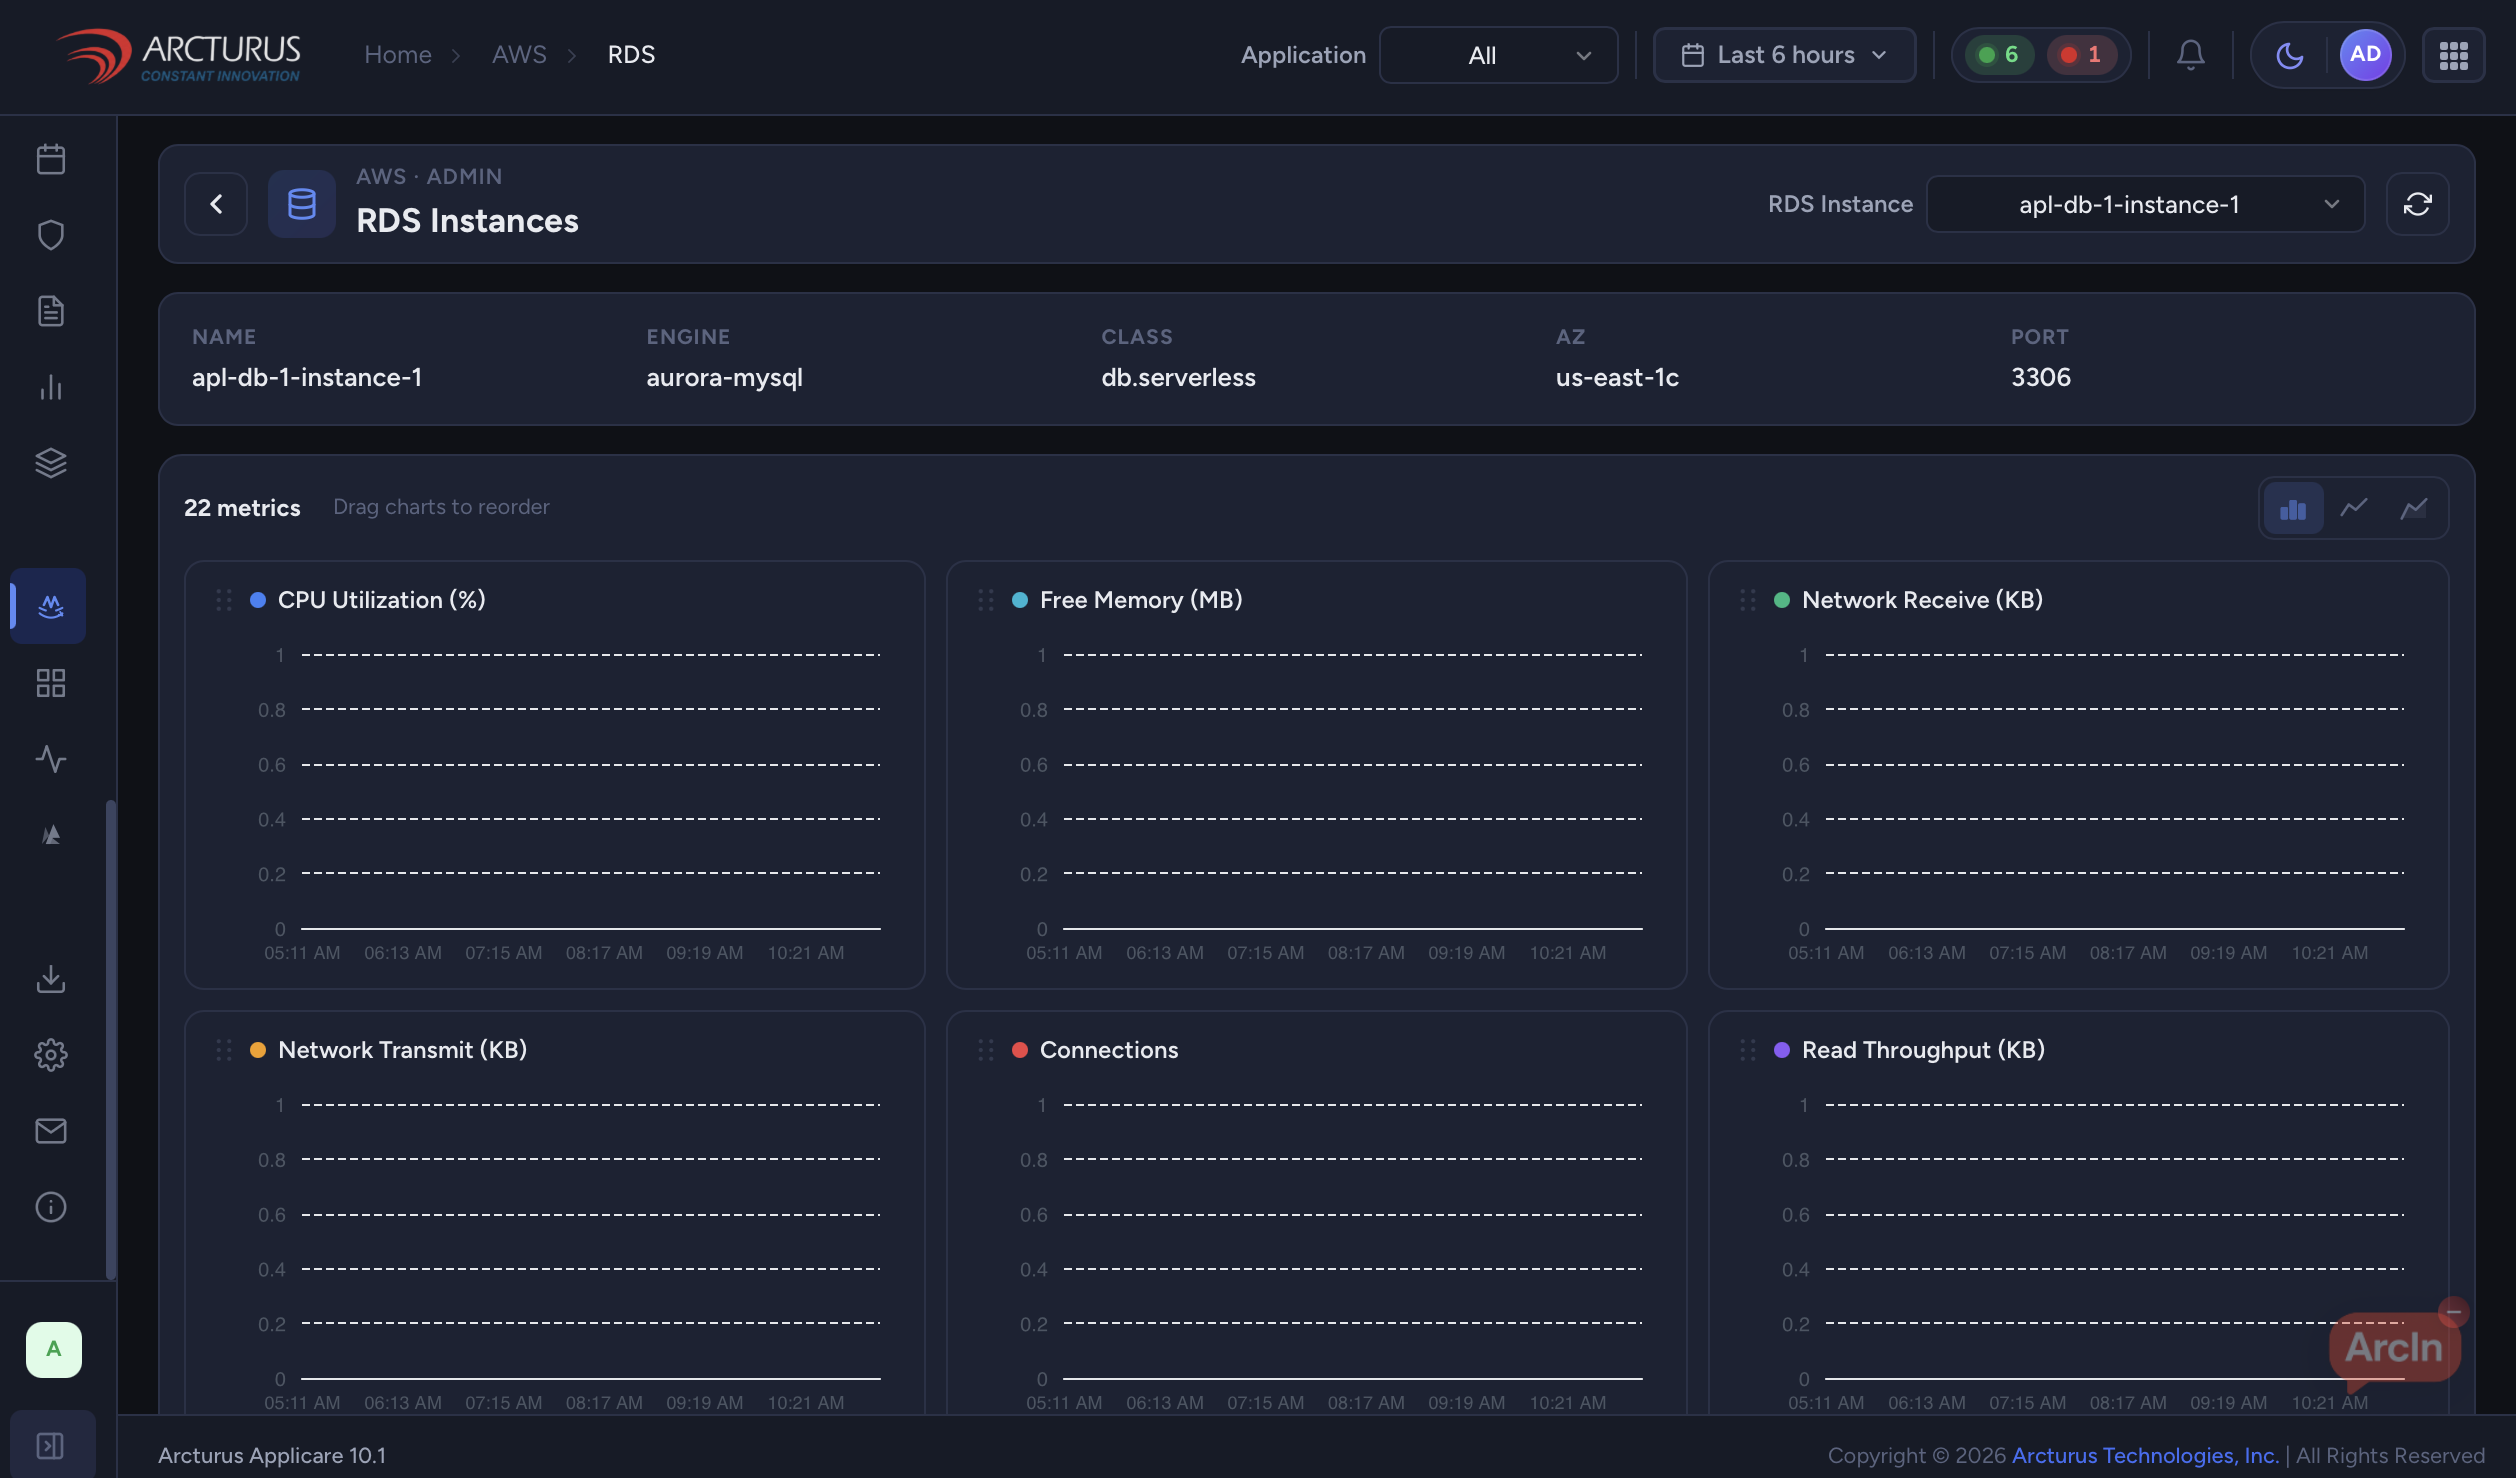
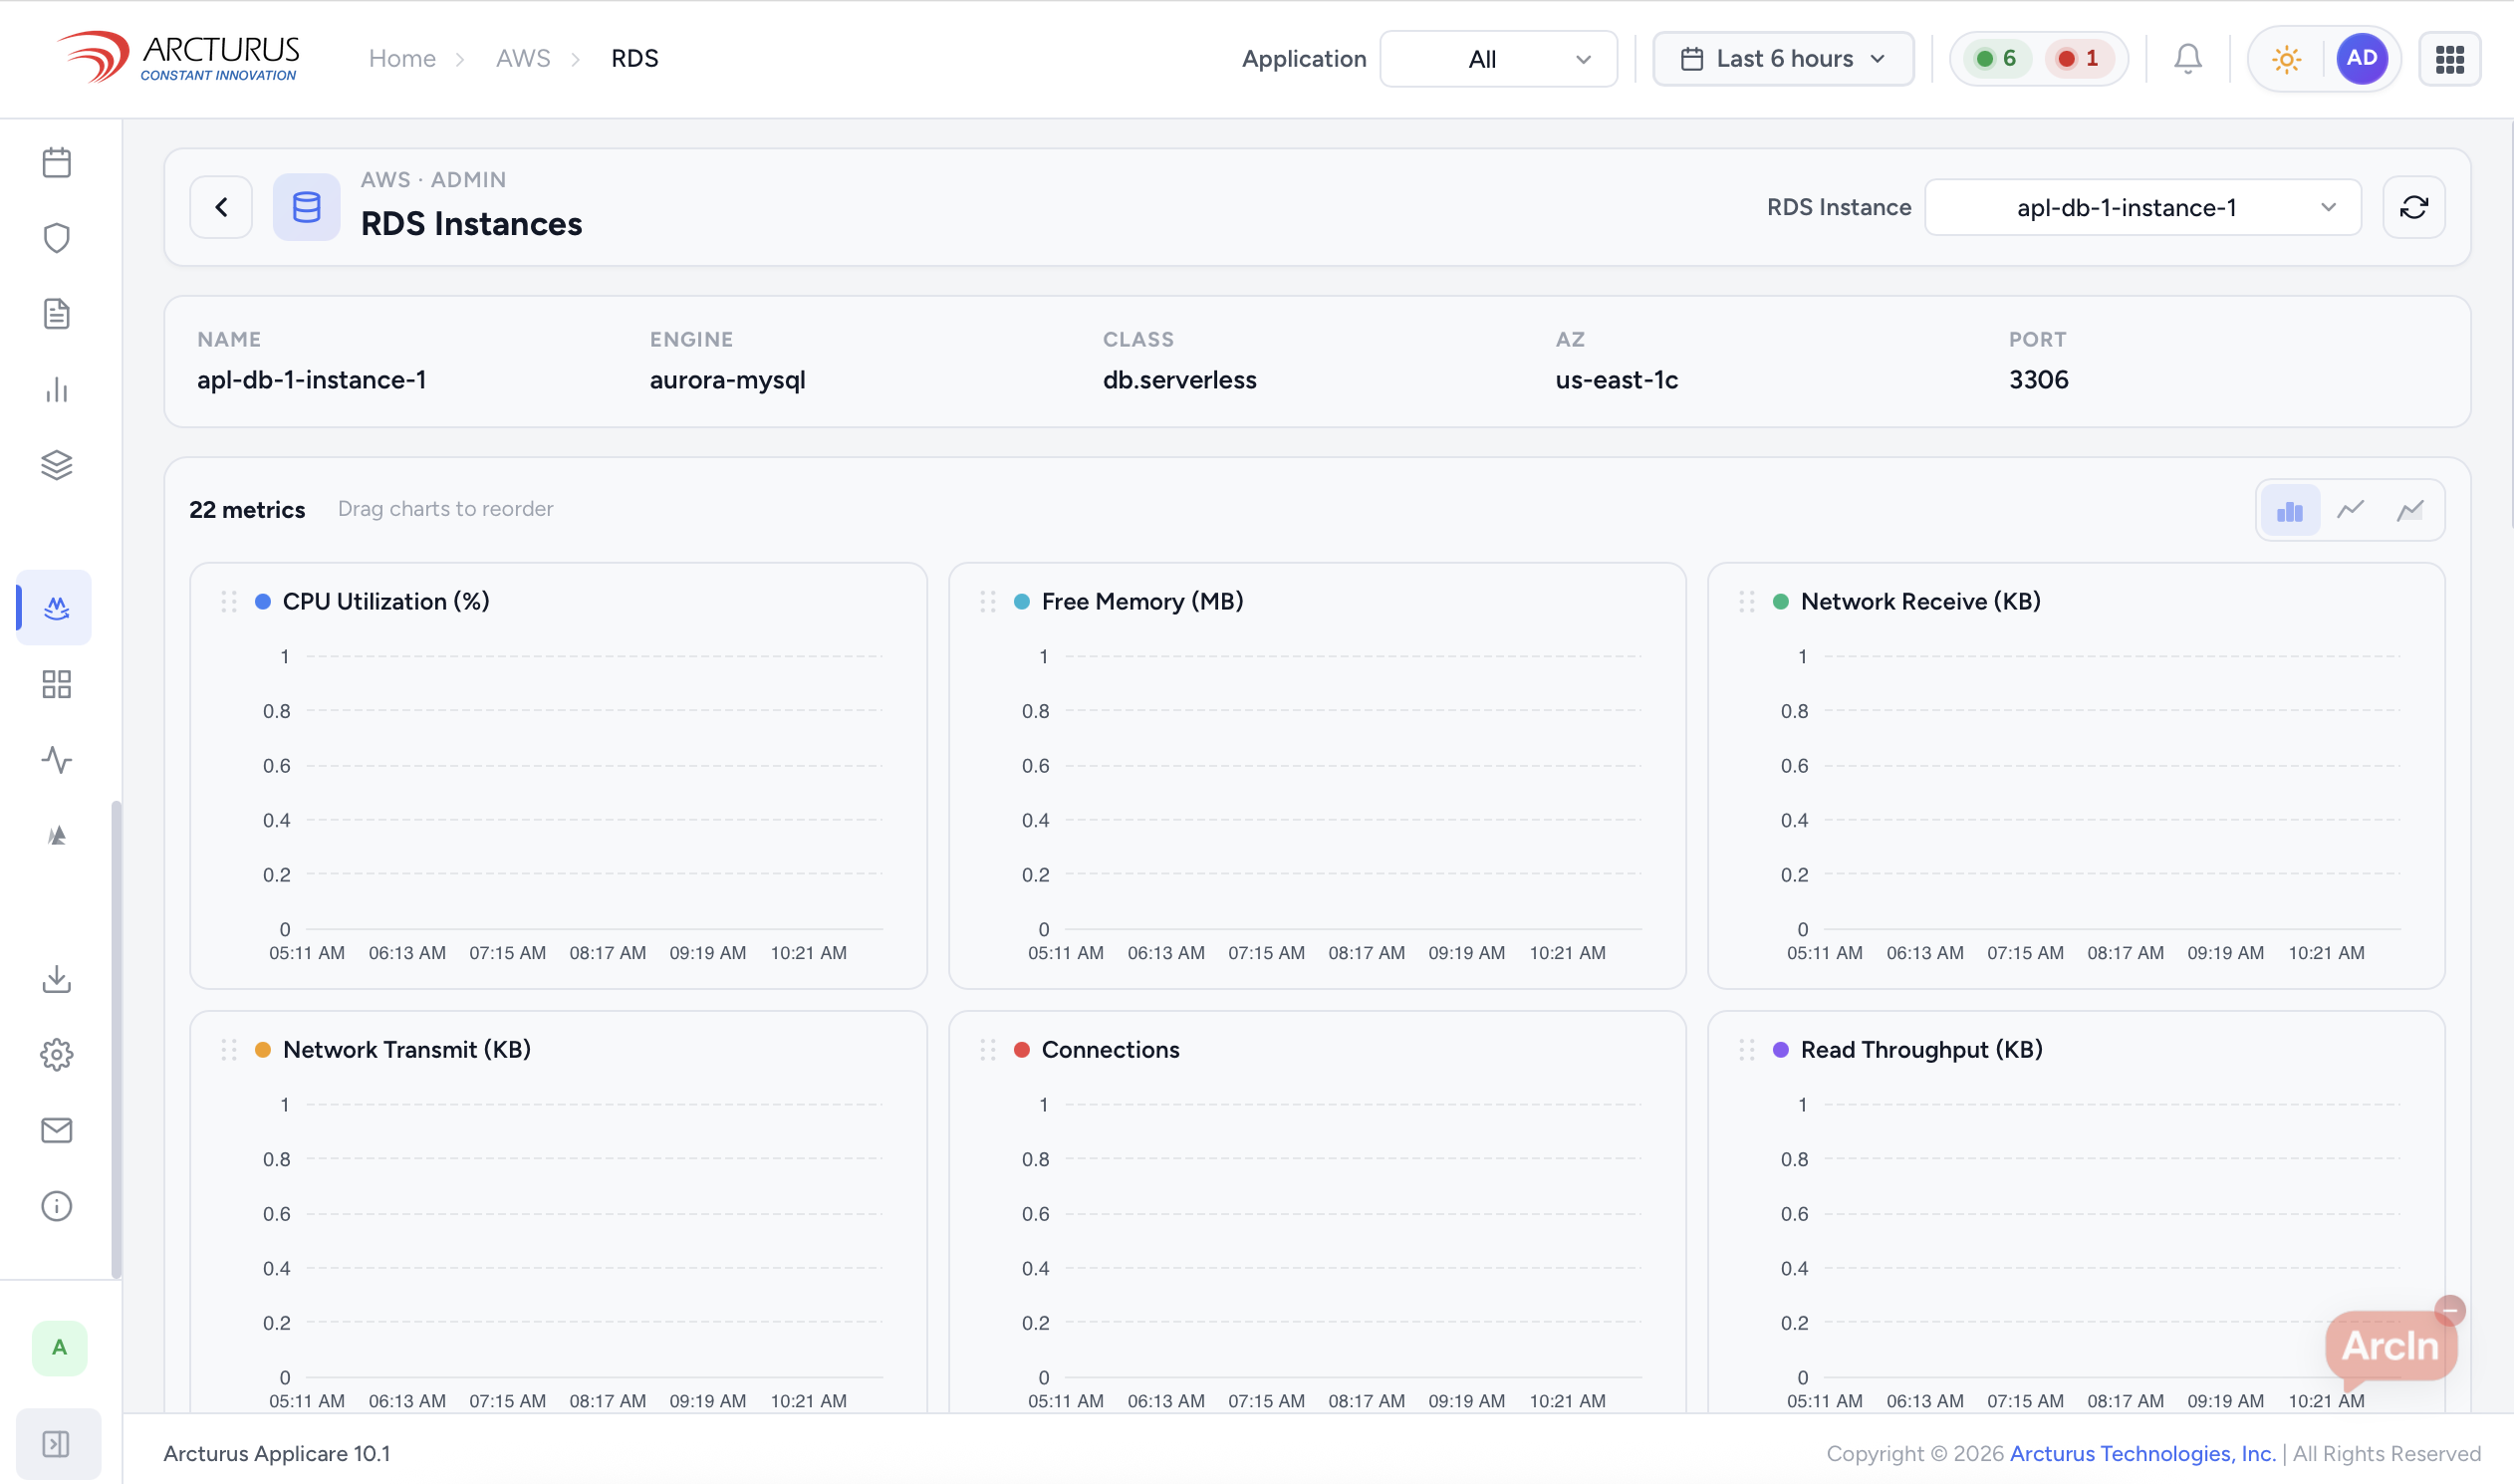
RDS instancesRDS instances
RDS & database performance
Reference Architecture

From edge to customer impact — one causal path.

Applicare follows the request through every AWS layer and connects it to the causality engine and recommended actions.

🌐 CloudFront / ALB
🔀 API Gateway
📦 ECS / EKS / Lambda
🗄 RDS / DynamoDB
🛒 Customer Transactions
🧠 ArcIn Causality Engine
⚡ Recommended Actions
Incident Investigation

See how Applicare investigates incidents.

10:03 AM
Deployment #4821 released
New checkout service version deployed to the ECS prod cluster
10:05 AM
RDS connections spike
Aurora connection pool utilisation rises from 44% → 96%
10:06 AM
SQS backlog increases
order-events queue: 12,000 messages in flight and growing
10:07 AM
Checkout latency rises
p99 latency: 150ms → 2,790ms · error rate +4.3%
10:08 AM
🧠 ArcIn identifies root cause
N+1 query in deploy #4821 · Aurora pool exhausted · 3-service cascade confirmed
10:09 AM
⚡ IntelliTune recommends remediation
Option A: roll back deploy. Option B: apply query-cache patch (no downtime)
ArcIn — Causality Analysis⬤ Resolved 10:09
🧠 ArcIn Root Cause:
Deploy #4821 added 23 SQL queries per checkout (N+1 on cart.getItems()). Under load, Aurora connection pool (limit 200) reached 192/200. SQS consumers blocked on RDS. Full cascade took 4 minutes.
⚡ IntelliTune:
Recommended: eager-load cart items (1 query vs 23). Auto-patch available. Estimated resolution: 4 minutes, zero downtime.
Traditional Monitoring
6–20
minutes to understand
Applicare
<60s
to root cause + remediation
Entity Graph

Every dependency. One graph.

Applicare continuously maps the relationships between accounts, regions, VPCs, EC2, ECS/EKS, Lambda, RDS, queues, APIs, and customer transactions — so teams immediately understand how a failure propagates across AWS.

Live Entity Graph — AWS
ALB (prod-us-east-1)Healthy
└─ routes to ────────────────
ECS Service (checkout)Latency ↑
└─ invokes ──────────────────
Lambda (order-processor)Running
└─ queries ──────────────────
Aurora / RDS (orders-db)🔴 Root Cause
└─ impacts ──────────────────
Customer Checkout FlowLatency 2.8s
└─ analysed by ──────────────
ArcIn Causality Engine✓ Root Cause + Fix
Auto-discovered in 10.6s · Updated every 15s · 980 entities mapped
🔗
Cross-account causal topology
Every AWS account, region, service, deploy, and user transaction linked in a living graph. Incidents spanning five services surface as one root cause, not five alarms.
Auto-discovered via a read-only IAM role
Deploy-correlated intelligence
Every CodeDeploy / ECS rollout tracked against baselines. Regressions detected within seconds — before the on-call pager fires.
Deployment gates · automatic rollback triggers
💡
Cost & customer impact
Each incident correlated with affected sessions, transactions, and AWS spend — so you prioritise what matters to the business.
38% average AWS cost reduction
Native Integrations

Built for modern AWS environments.

Deep native coverage of 30+ AWS services — one read-only IAM role, no custom exporters, no agents to manage.

🖥
EC2
☸️
EKS
📦
ECS / Fargate
Lambda
🗄
RDS / Aurora
🔶
DynamoDB
🗂
S3
📨
SQS / SNS
🌐
API Gateway
ELB / ALB
🛡
VPC
📡
CloudFront
📋
CloudWatch
🔍
X-Ray
🔒
IAM
Customer Outcomes

Proven results across industries.

Global Retail Enterprise
Challenge: Checkout failures during peak sales events on EC2 + RDS causing revenue loss.
faster incident resolution
99.99%
uptime achieved
65%
fewer customer complaints
Financial Services Platform
Challenge: Cross-region latency and unpredictable AWS spend creating Sev-1 incidents.
82%
reduction in MTTR
41%
lower AWS spend
96%
fewer Sev-1 incidents
Competitive Comparison

How Applicare stacks up.

CloudWatch gives you signals. Dynatrace adds visibility. Applicare delivers causality, business impact, and remediation.

CapabilityAWS CloudWatchDynatraceApplicare
Metrics & Logs
Full-Stack Visibility~ Partial
Cross-Account / Cross-Cloud Dependencies~ Limited✓ Native
Root Cause Analysis~ Alerts✓ <60s
Explain Why Incidents Happened✓ ArcIn AI
AWS Cost Intelligence~ Basic✓ 38% avg reduction
Recommended Remediation Actions✓ IntelliTune
Quick Start

Start understanding your AWS in minutes.

01
Connect your AWS account
A single read-only IAM role links all your accounts and regions. No agents to deploy.
02
Auto-discover dependencies
The entity graph maps EC2, ECS/EKS, Lambda, RDS, and queues in under 12 seconds.
03
Investigate & optimize
ArcIn delivers root cause with customer impact; IntelliTune recommends fixes and right-sizing.
Average time to first insight: under 30 minutes
AWS Incident Intelligence

CloudWatch shows you signals.
Applicare shows you causality.

What changed, why it happened, which services are affected, how customers are impacted, and what to do next — in under 60 seconds.