Monitor every database, catch performance bottlenecks before users do, get root cause in plain English, and let Applicare recommend — or automatically apply — the fix.
Most database monitoring tools tell you something is wrong. Applicare tells you why, what it affects, and what to do about it.
CPU, memory, disk I/O, connections, locks, replication, backups — correlated, not just collected.
Relational, NoSQL, in-memory, and cloud-managed — one entity graph, one AI, one console.
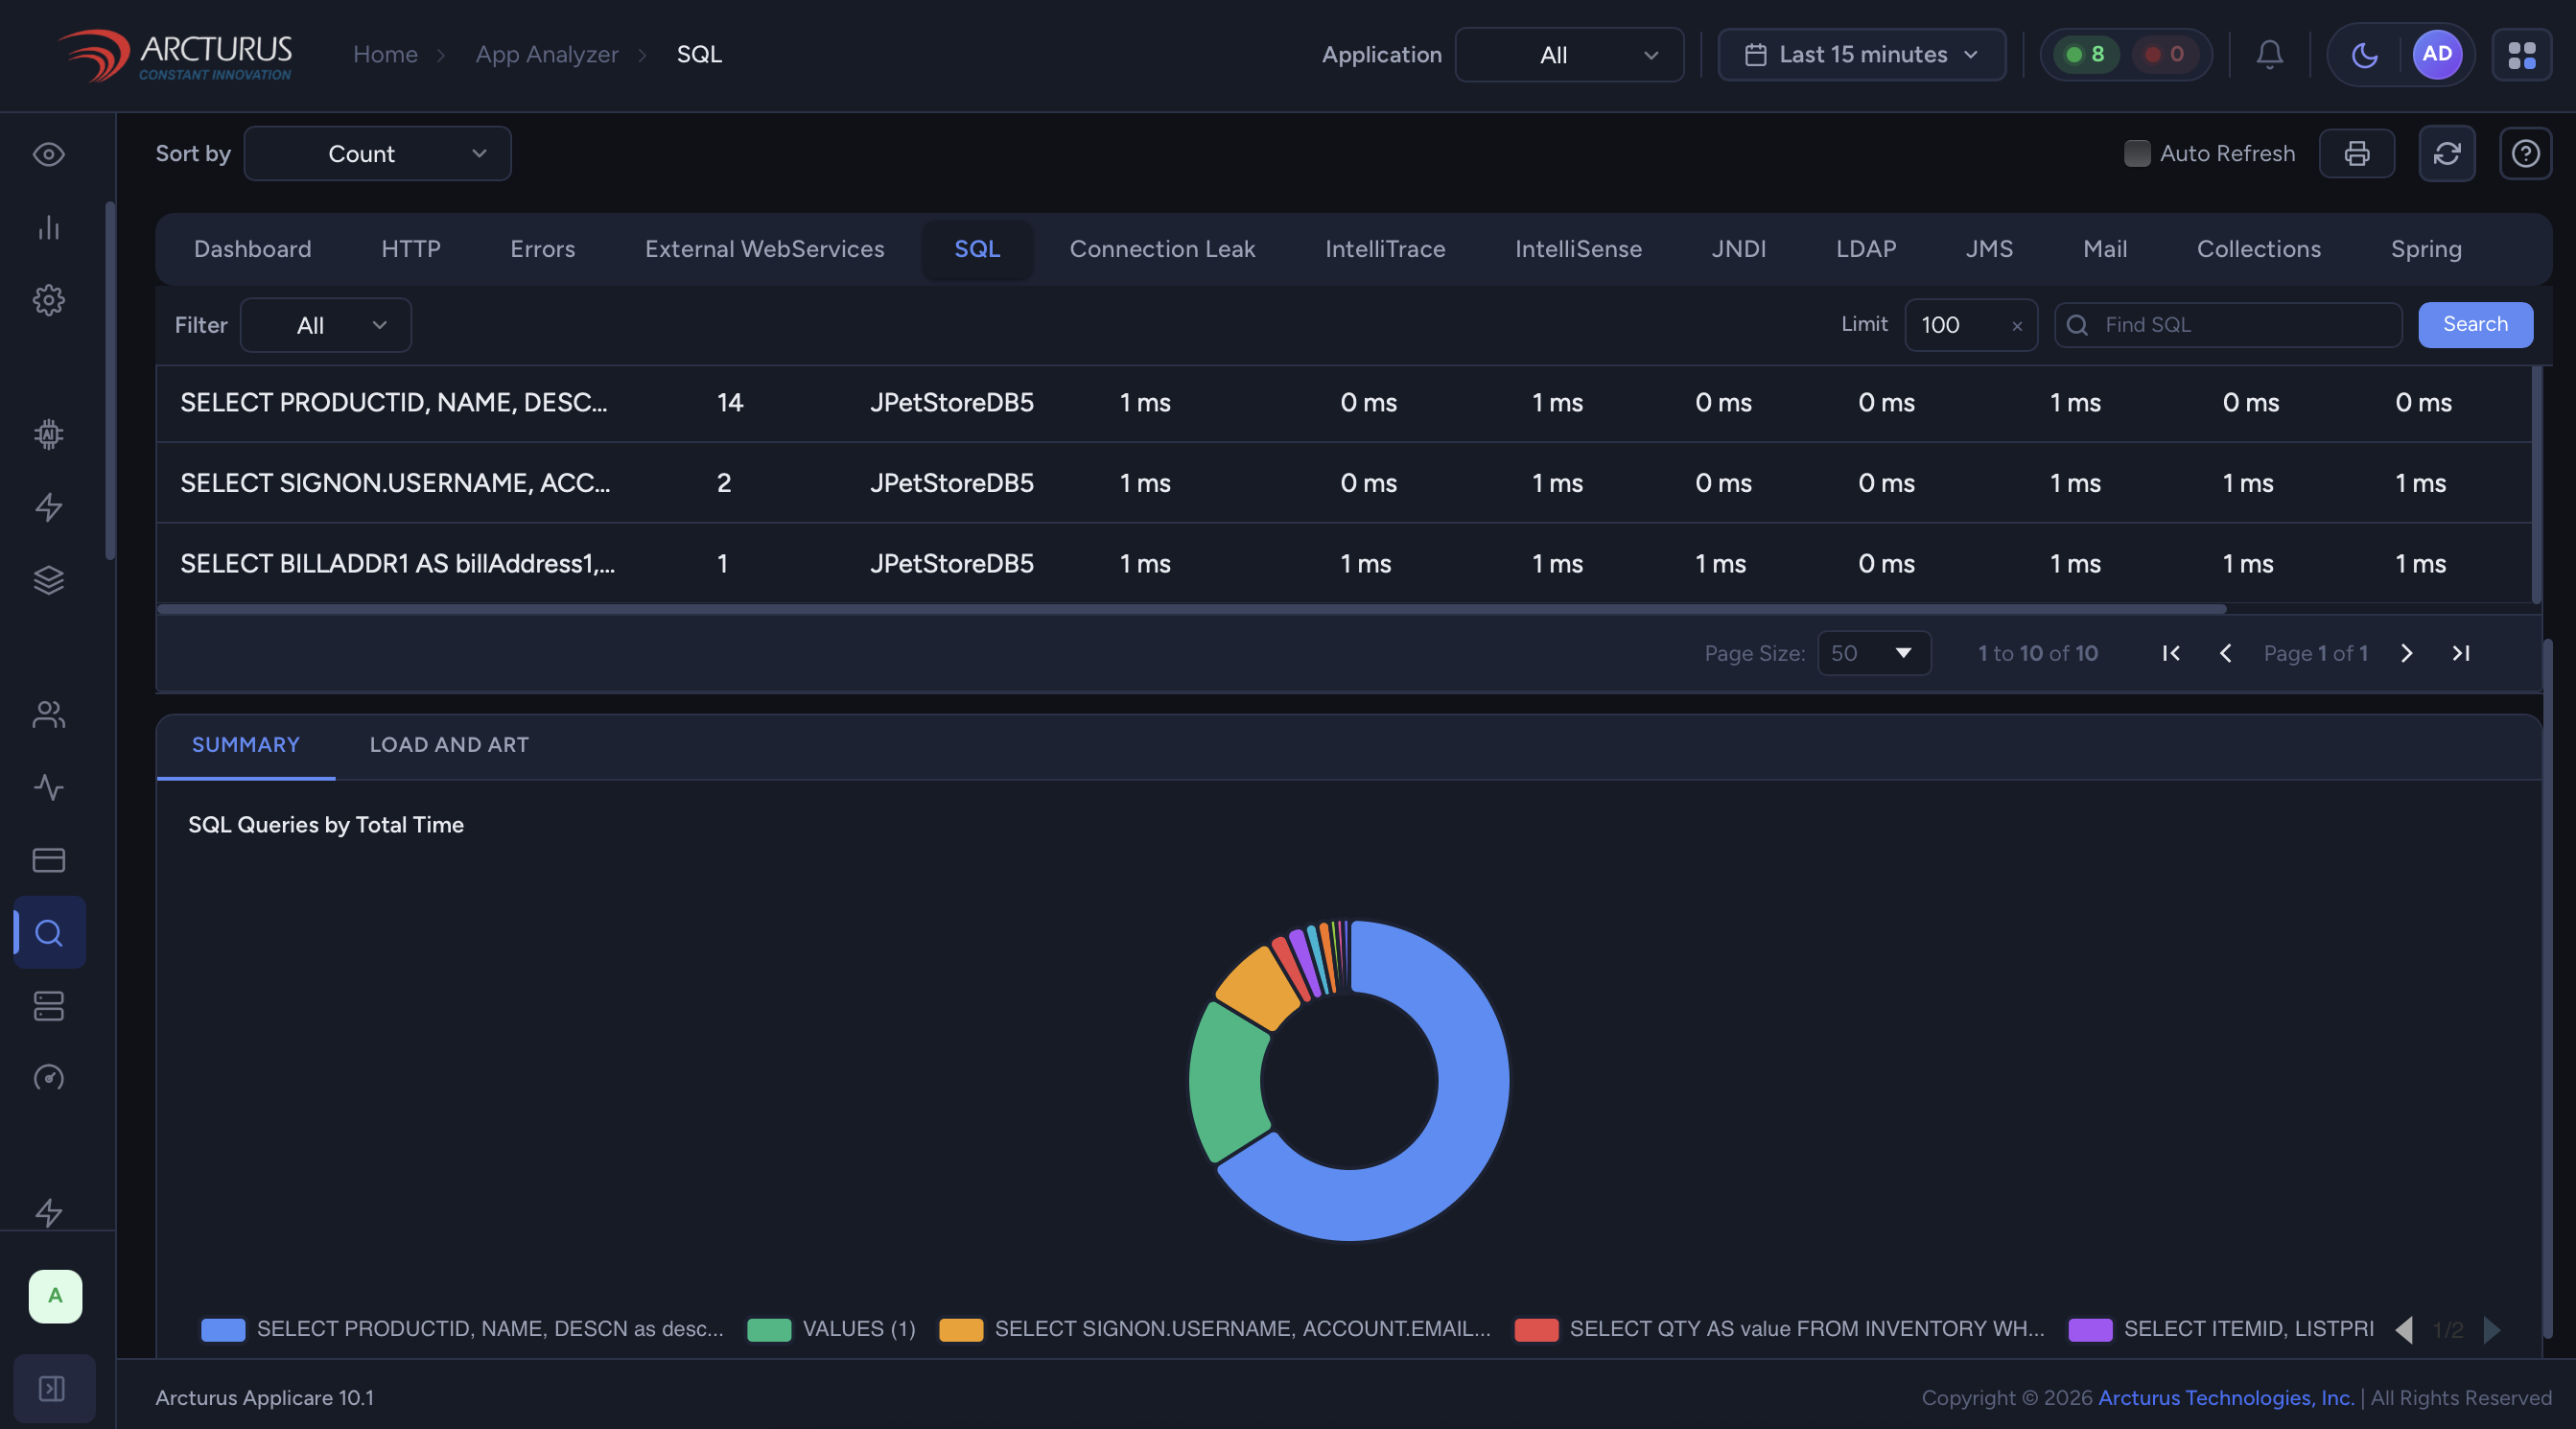
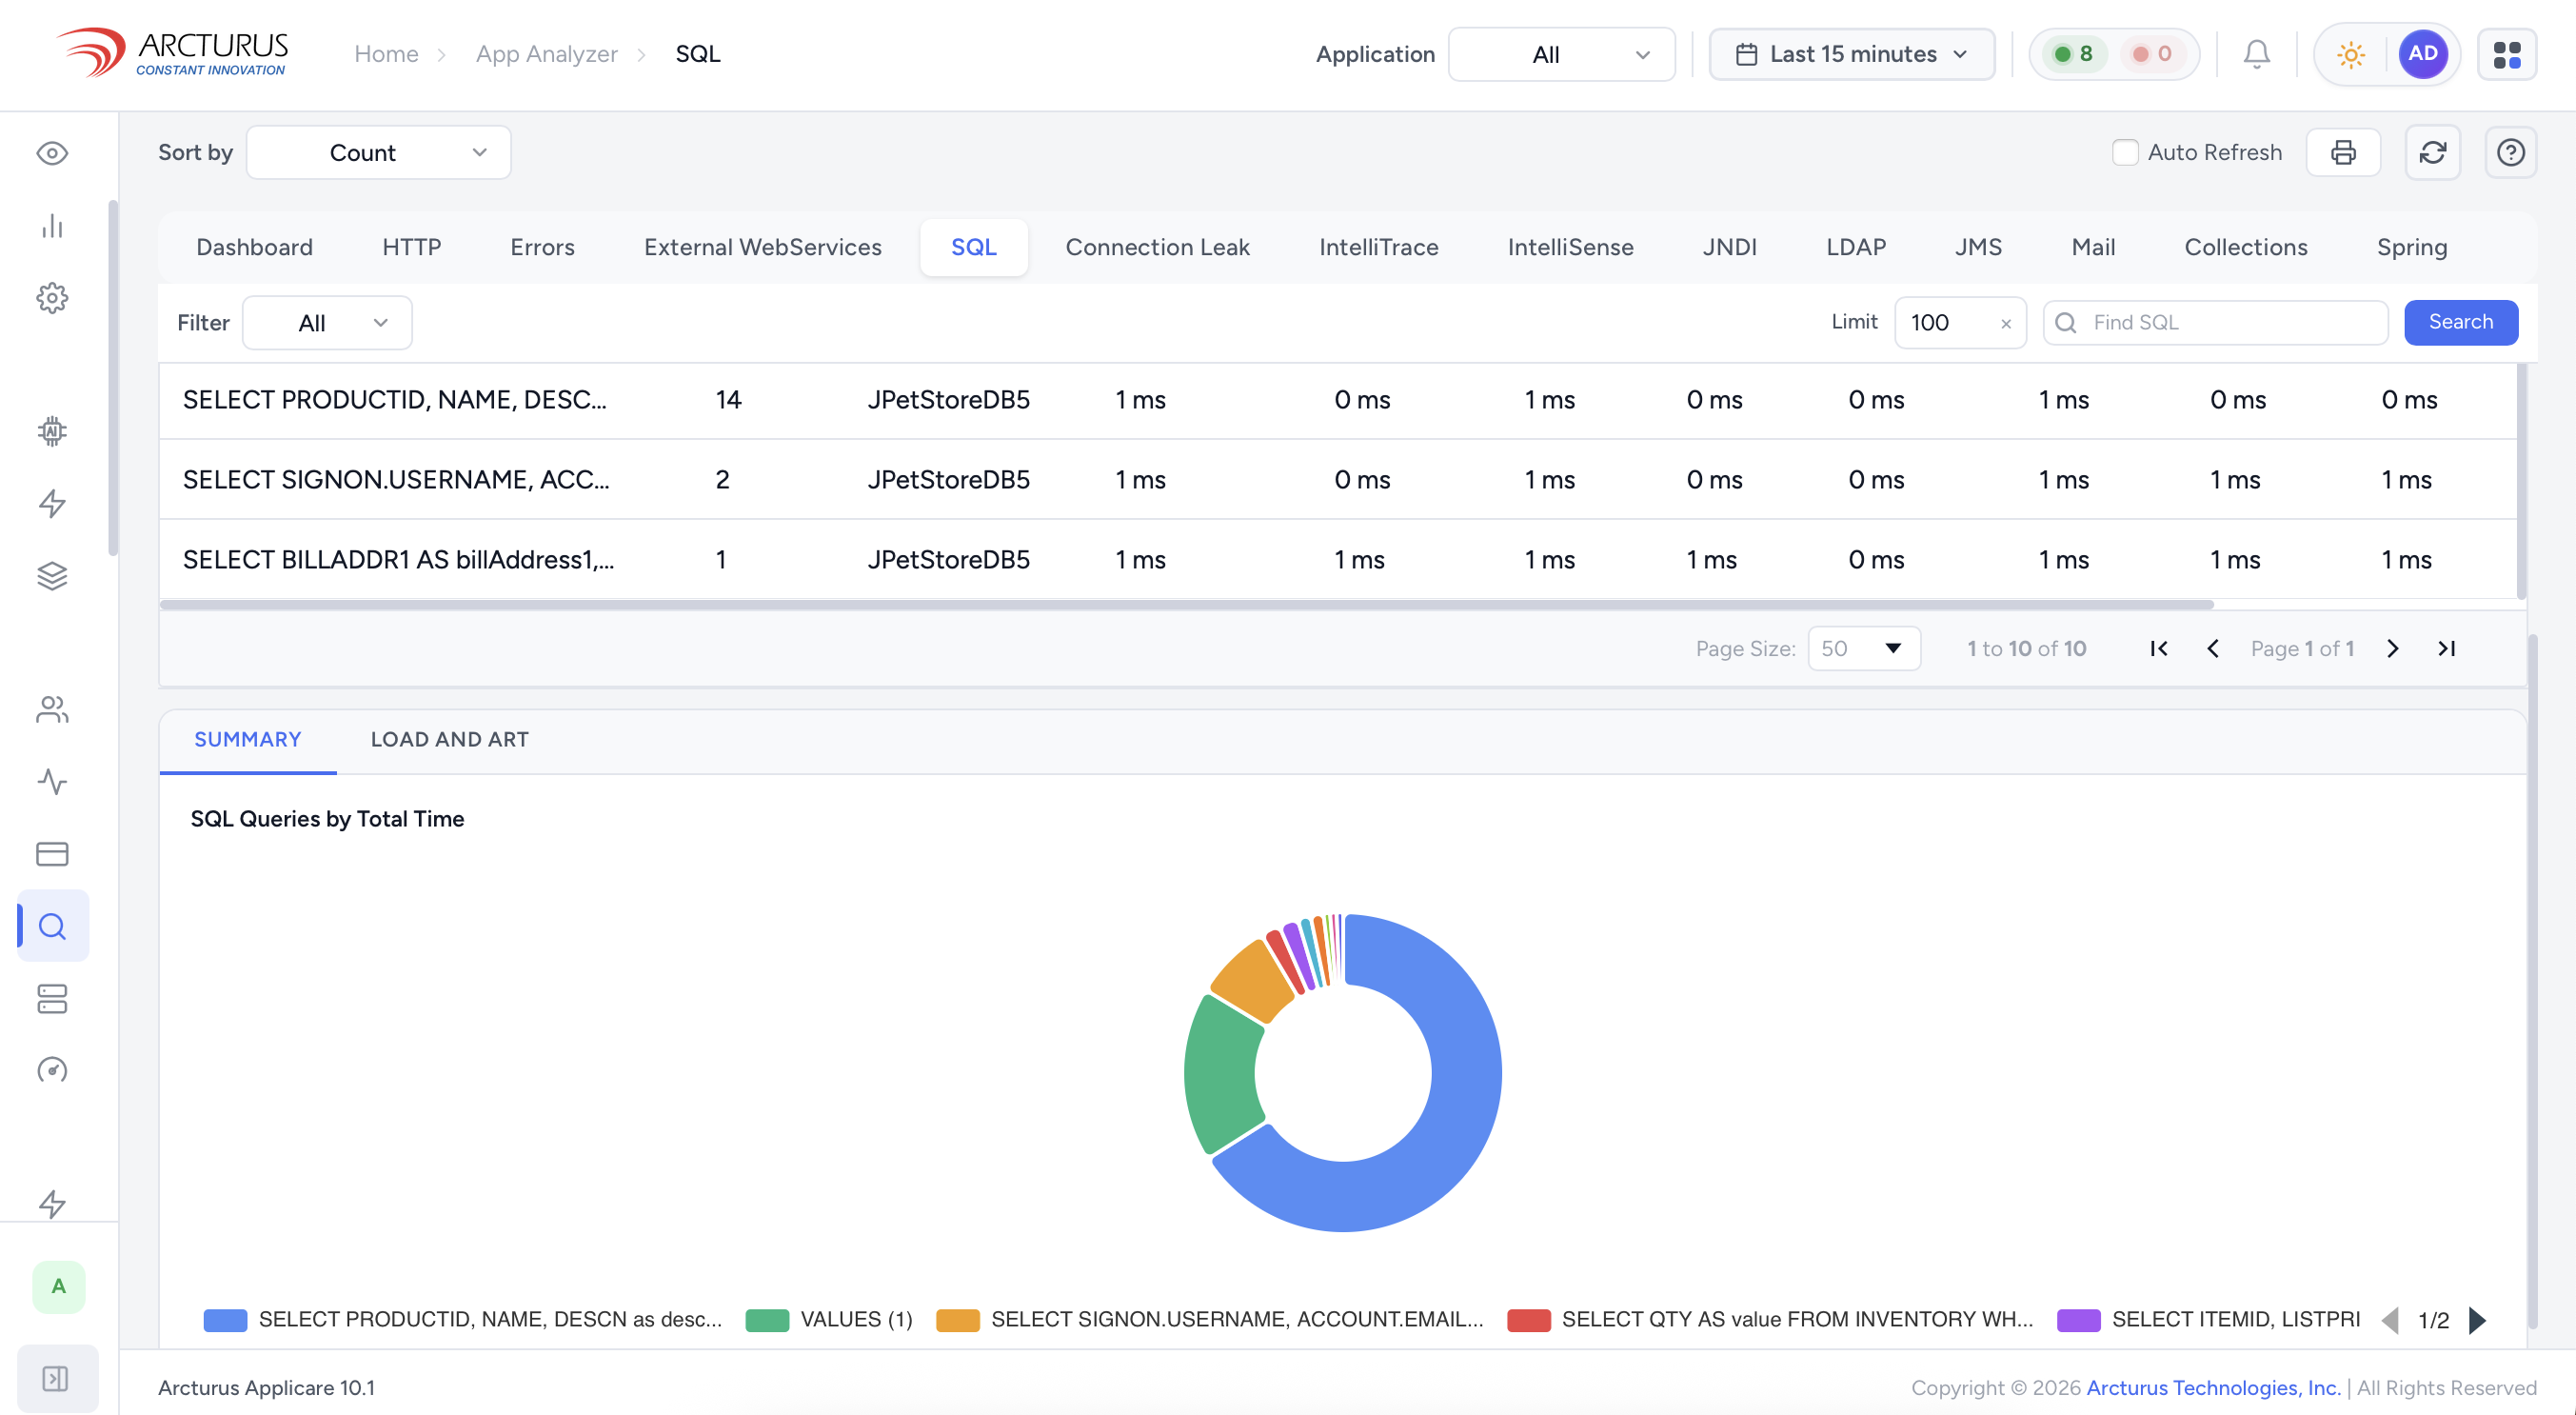
Applicare’s SQL Analyzer profiles every query your applications run — ranked by total time, not just raw count — so you fix what actually matters.
An application slowdown can have a dozen possible causes. Applicare walks the causal graph and finds the one that’s real.
No dashboards to hunt through. Ask in plain English, get root cause, impact, and a recommended fix.
IntelliTune executes the runbook for known failure patterns — with human approval where you want it in the loop.
A blocking session on orders-db isn’t a database problem — it’s a checkout problem. Applicare shows you which applications, APIs, and customers are affected before you open a war room.
“Our previous migrations always had database surprises post-go-live. For the first time, we knew exactly what to fix before we started. The level of pre-migration intelligence was something we had never seen from any tool before.”
| Capability | Applicare | Traditional APM |
|---|---|---|
| Conversational AI investigation | ✓ ArcIn AI | Limited or none |
| SQL intelligence & auto-optimization | ✓ Query + plan + index | Manual tuning |
| Business impact analysis | ✓ App/API/customer level | Infrastructure metrics only |
| Auto-remediation | ✓ 200+ runbooks | Alerting only |
| Cross-domain correlation | ✓ App to storage, one graph | Siloed per data source |
30 minutes. Read-only access. No prep required. We connect to your databases and show you what Applicare finds — live.