The Platform

One causal entity graph. Four AI engines. Built for enterprise engineering teams who need answers, not dashboards.

⬡ Platform overview → ◯ Four engines → ▶ How it works → → Start free trial →

What we solve

Applicare enables teams to observe, automate, and resolve incidents faster across every stack.

★ Customer stories → → Try it free → ◯ Platform overview →
Learn
Blog
Engineering insights & deep dives
Webinars
Live sessions & on-demand recordings
Case Studies
Proven results across industries
White Papers
Research, architecture guides & reports
Customer Stories
Real teams, real outcomes
Product News
What’s new in Applicare
Adopt & Grow
Applicare University
Free courses for Applicare engineers
Learning Center
Every video lesson, searchable in one place
Documentation
Guides, APIs & integration docs
About Arcturus
Our mission, story & team
Partners
SI, MSP & technology partners
Community
Slack, GitHub & developer forum
Support
Helpdesk & customer portal
Downloads
Ops Vault
Datasheets, runbooks & toolkits
Featured Case Studies
AeroMexico
Digital ticketing · MTTR 4.5h → 11min
Leading Private Bank
MTTR 3.2h → 18min · first month
Mediclinic
Audit prep 11 weeks → 18 days
NTT DATA
80% on-call page reduction
Danube Group
94% SLO compliance
ONP
0 violations at last audit
Seygen
78% downtime reduction · GxP compliance
Insurance Tech Platform
67% P1 reduction · $2.4M saved
IIS & Server Availability
100% SLA report accuracy
Health Check Offering
4.2x ROI · 48hr delivery
Bank of Muscat
99.95% core banking uptime
Aster Hospitals
Deeper IIS application visibility
By Industry
Financial Services
Airlines & Transport
Healthcare
Government
Retail & E-Commerce
Pharmaceuticals
Insurance Technology
Managed Services
Enterprise IT
Professional Services
Home
ArcIn AI
Login Book a Demo
Flutter Web Monitoring

See the experience. Trace the transaction. Find what matters.

Applicare helps teams understand the complete Flutter Web experience — from application health, crashes and screen performance to network calls and the backend services and databases behind every request.

Flutter WebCrashesNetworkTransaction tracingSessions
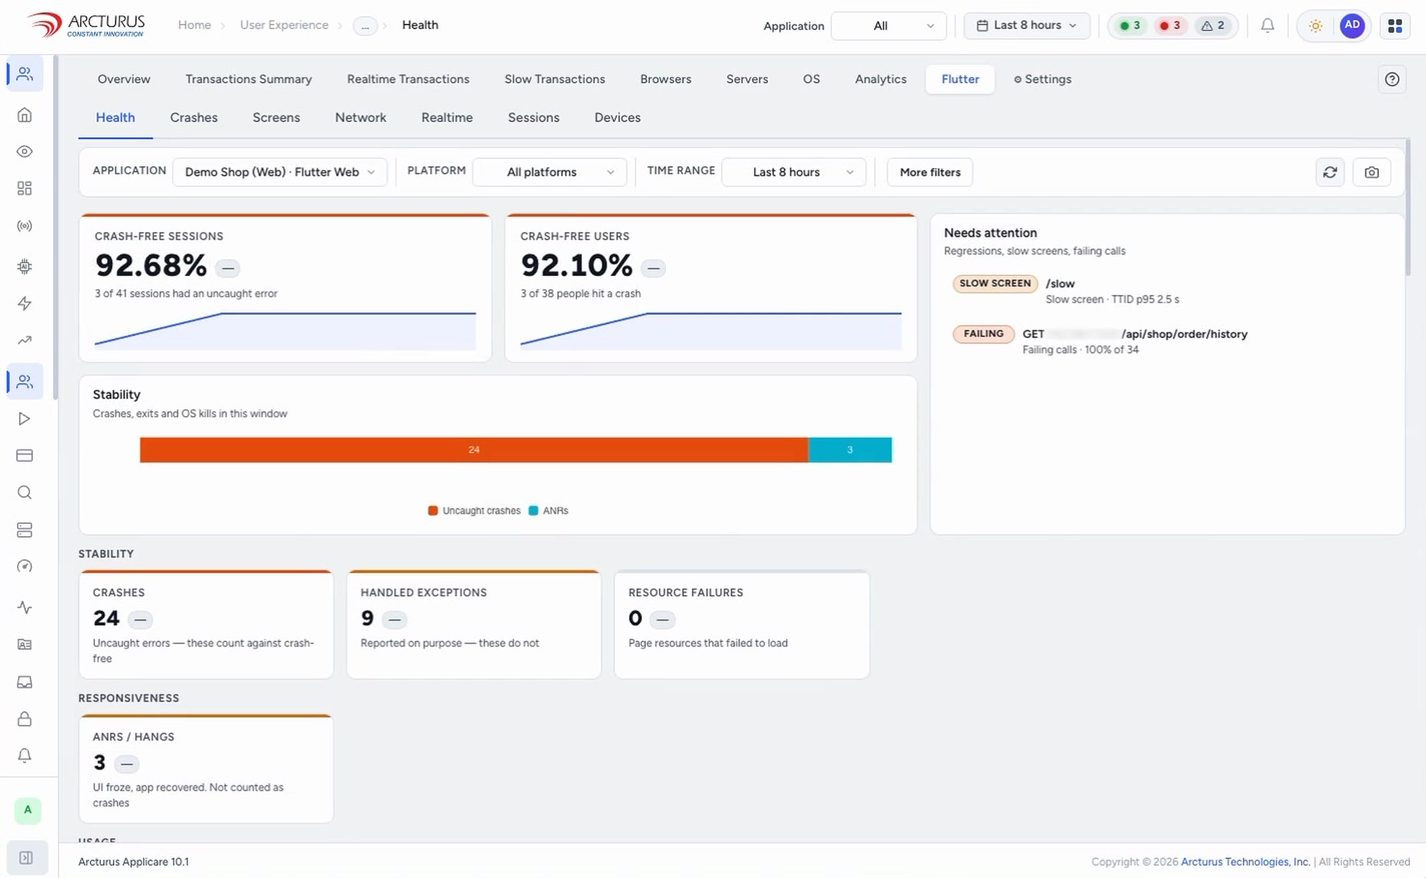
 applicare · application health
Applicare application health view for a Flutter Web application showing crash-free sessions and users, stability and responsiveness
Demo application · sample data
Browser
to backend in one trace
Crashes
by kind, group and status
Real-time
call and transaction activity
Sessions
with device and location
Introduction

Understand the complete Flutter Web experience.

Flutter Web applications render in the browser and depend on APIs, services and databases behind them. When something feels slow or breaks, the cause can sit in the app, the network or the backend. Applicare puts all three in one place.

See the user experience

Application health, crashes, screen performance and sessions show how the application feels to real users.

Trace the transaction

Follow a request from the end user and Flutter application through the browser and network to application services and databases.

Find what matters

Spot where attention is needed, which screens and calls are slow, and which users and devices are affected.

Monitoring capabilities

One view of every layer of the experience.

Each view in the Flutter tab answers a specific question about the application.

Application health

Crash-free sessions and users, stability, handled exceptions, resource failures, ANRs and hangs, and a crash-free trend over time.

Crashes

Errors per hour by kind, a breakdown of crash kinds, top crash groups ranked by users affected, and a triage list by status.

Screen performance

Slowest screens, time to initial display, frame health and the slowest individual transactions, with trends for each screen.

Network activity

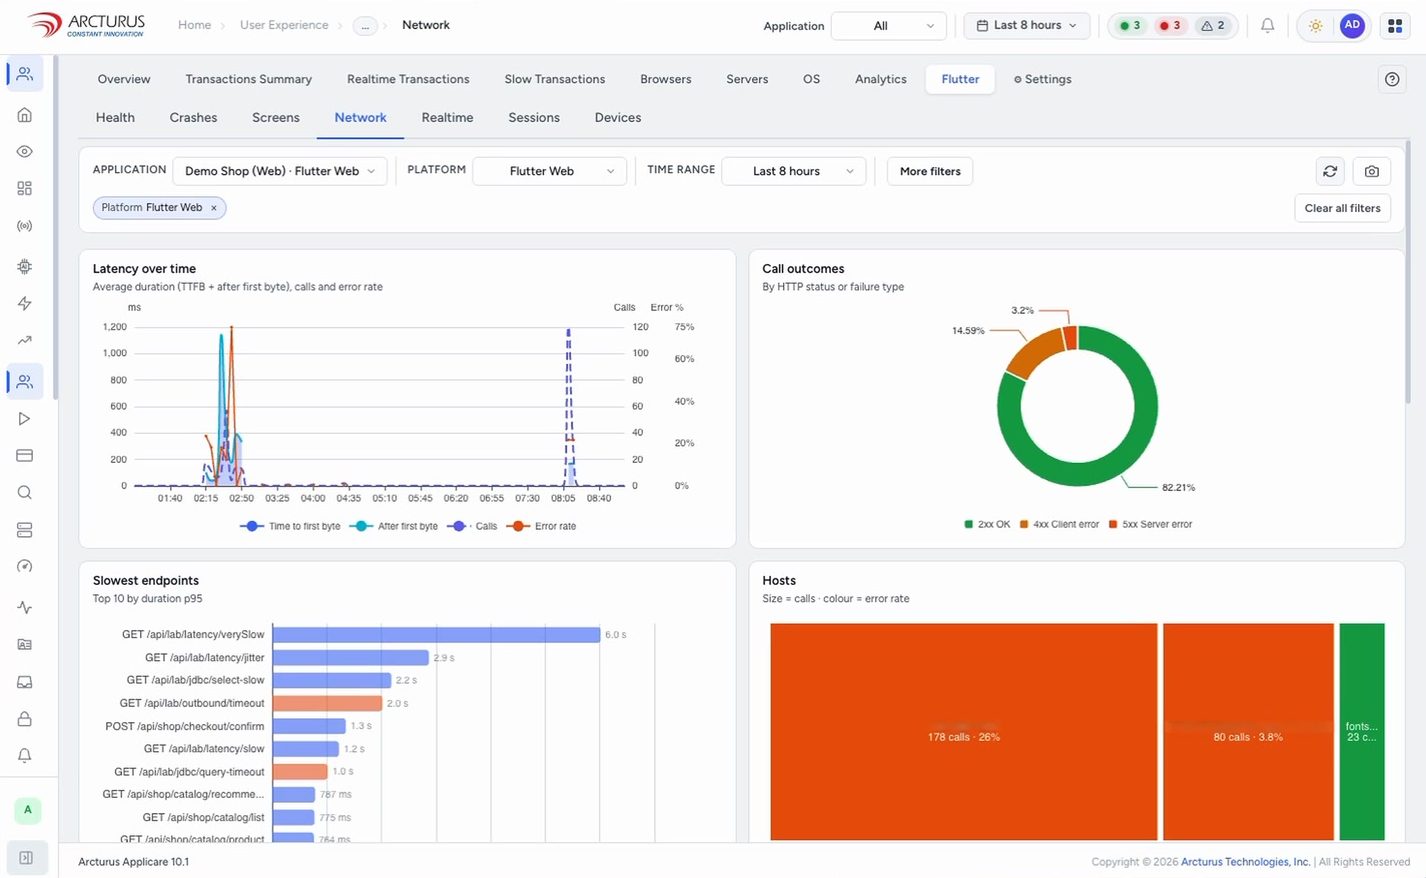
Latency, call outcomes, slow endpoints, destination hosts, response sizes and an endpoint table where any call can be opened.

Real-time activity

Current calls with their duration, status and screen. Select a call and the charts above filter to it.

Sessions and devices

Session length, screens per session, SDK versions, per-session timelines, plus country, browser, device and OS breakdowns.

Product demonstration

Watch the full walkthrough.

A narrated tour of Flutter Web monitoring in Applicare, using a demo application with sample data. Runtime 4:42.

Service & transaction investigation

From a slow screen to the exact call behind it.

Move from the symptom a user feels to the request, service or query responsible.

 applicare · screens
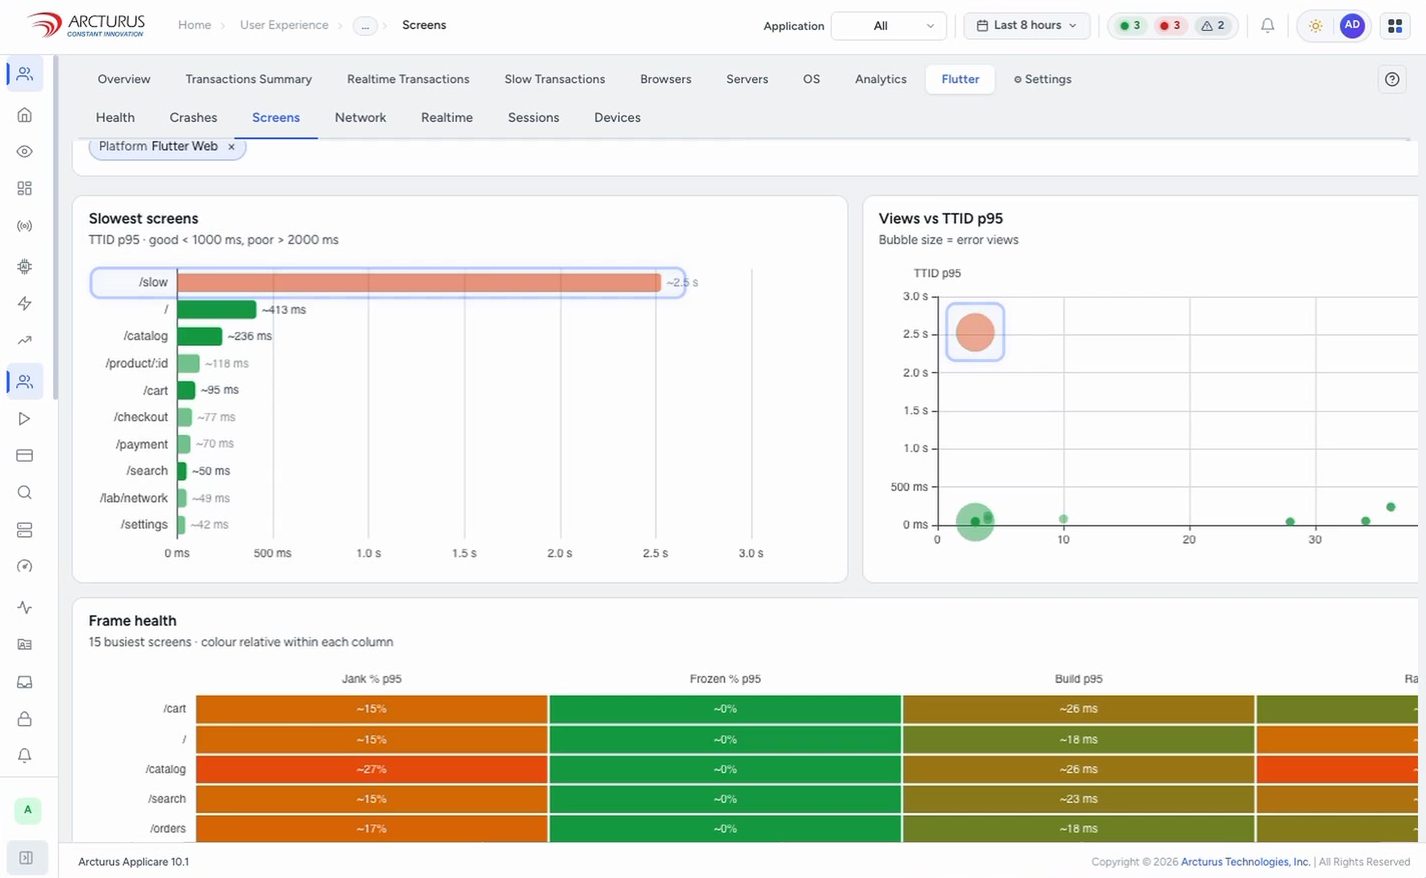
Applicare Screens view listing the slowest screens, views versus time to initial display, and frame health

Find the screens affecting users

Rank screens by time to initial display, compare views against load time, and examine frame health to see which parts of the application may be affecting responsiveness.

  • Slowest screens at a glance
  • Frame health across the busiest screens
  • Open any screen for its trends

Connect the experience to network behavior

Examine latency, request outcomes, errors, slow endpoints and destination hosts to quickly isolate where communication is breaking down or slowing the experience.

  • Latency and call outcomes
  • Slowest endpoints and hosts
  • Response sizes and bytes received
 applicare · network
Applicare Network view with latency over time, call outcomes, slowest endpoints and destination hosts
 applicare · transaction flow
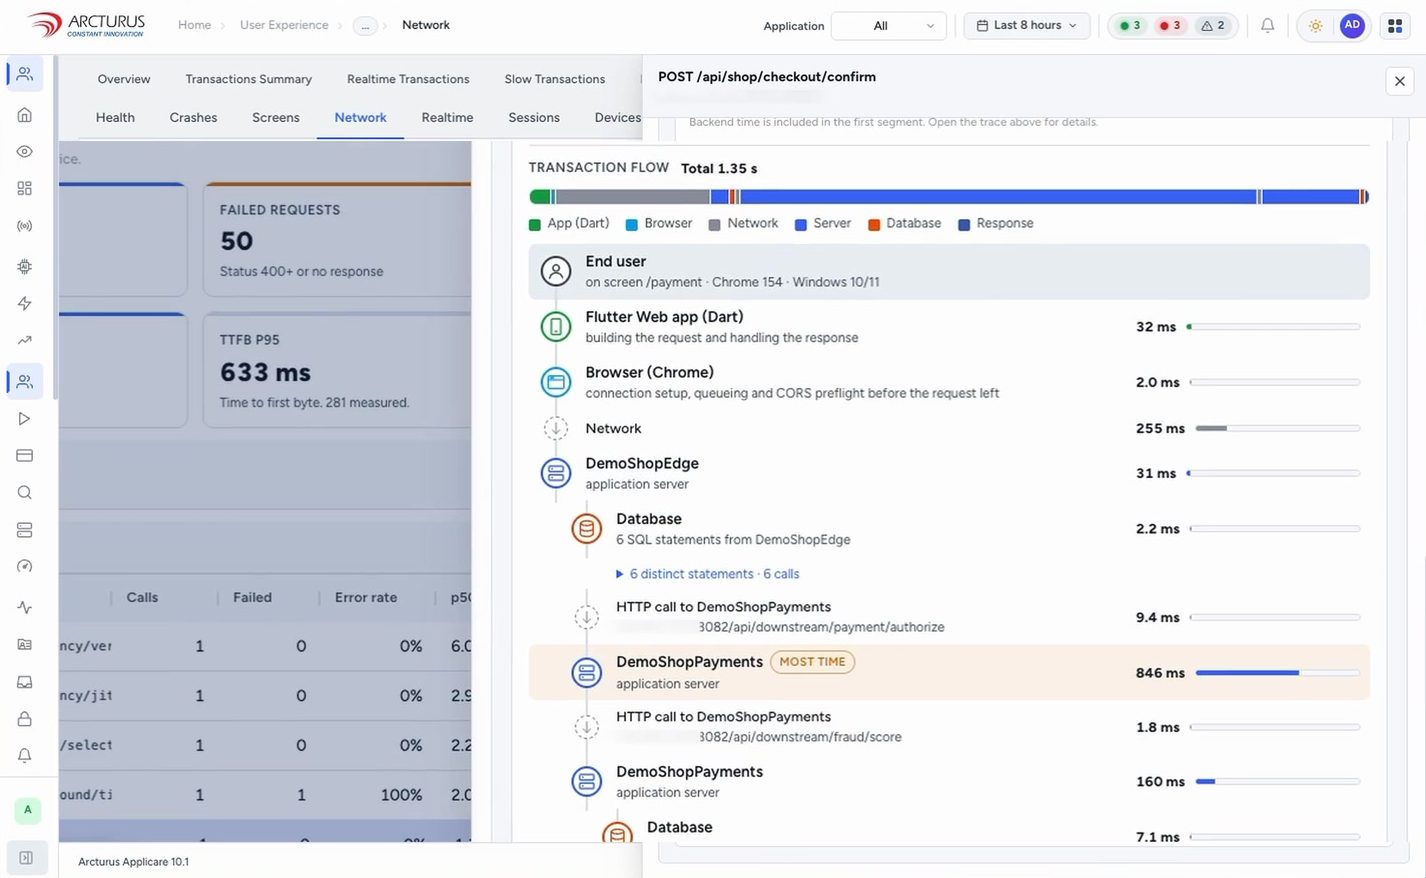
Applicare transaction flow showing time spent in the Flutter app, browser, network, application services and database

Trace a transaction beyond the browser

Open a call and see the journey from the end user and Flutter application through network activity, application services, databases and downstream dependencies — with timing that shows where the transaction is actually spending its time.

  • Time per hop, with the slowest step highlighted
  • Each SQL statement listed with its own timing
  • Downstream service calls in the same trace

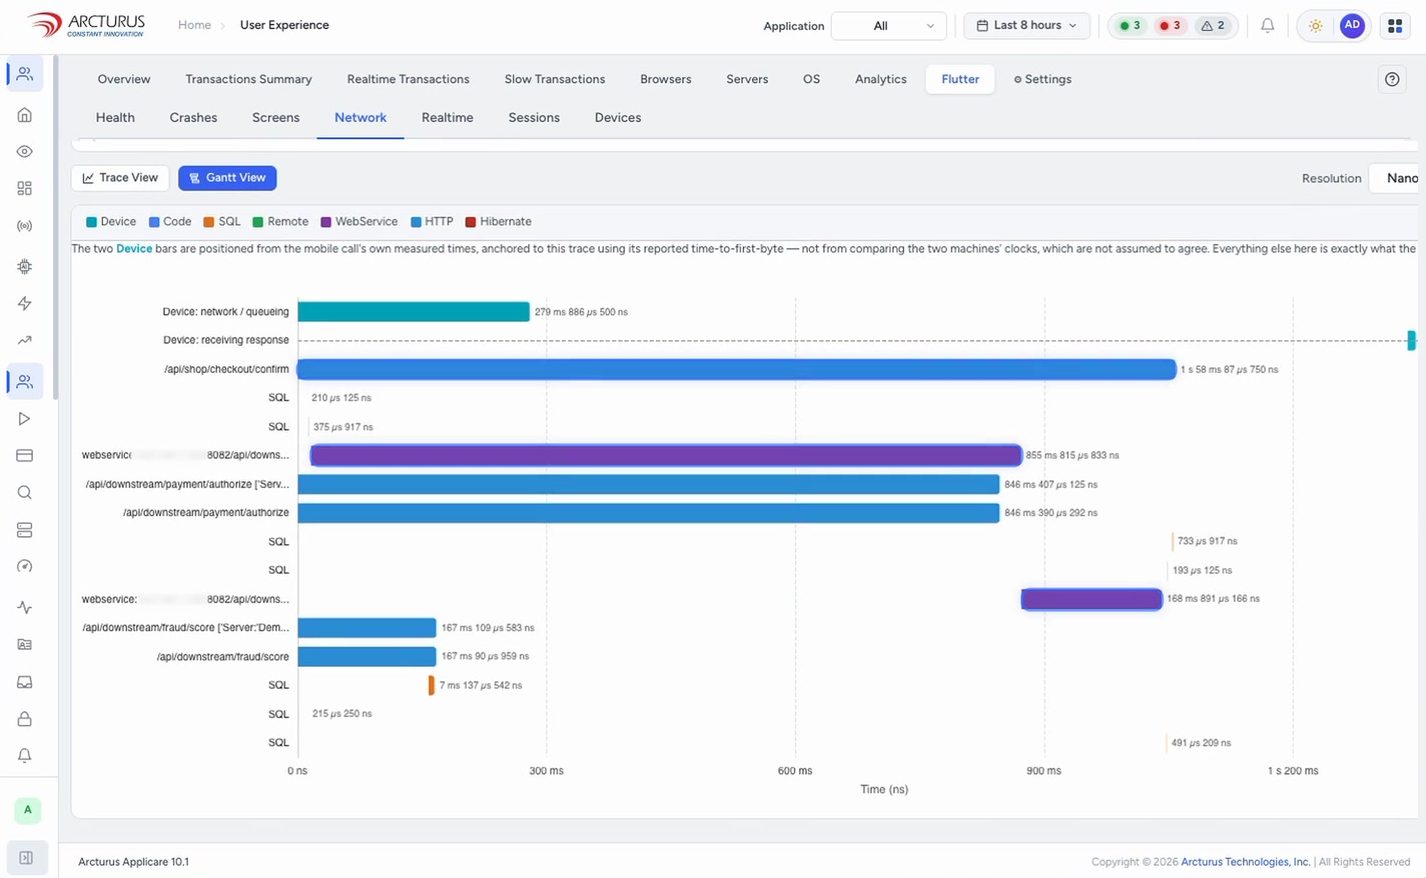
Read the work against time

The full trace splits a call between the device and the backend, and the waterfall lays the same work out against time so you can see what ran, in what order, and for how long.

  • Device and backend split
  • Trace and waterfall views of the same call
 applicare · trace waterfall
Applicare waterfall view laying out device, SQL and service work against time for one transaction
Architecture

Flutter-to-backend, in one trace.

Applicare follows a request through every tier it touches, so the browser experience and the backend work are read together instead of in separate tools.

01
End user
Browser session
02
Flutter Web app
Screens and calls
03
Network
Browser and network
04
Application services
Backend tiers
05
Databases
SQL statements

Tiers and timings are shown per transaction in the Applicare trace view.

ArcIn AI

Applicare ArcIn across your stack.

ArcIn is the AI layer of the Applicare platform. It works from the same telemetry Applicare collects, so signals from the application, network, services and infrastructure can be considered together.

Correlated signals

Relates symptoms across the layers Applicare monitors, rather than leaving each view to be read on its own.

Likely cause, surfaced

Helps point investigation toward the likely cause so teams spend less time searching.

Same platform, same workflow

Works alongside the views on this page — health, crashes, network and traces.

Benefits

What teams gain.

One view from user experience to backend
Faster path from symptom to responsible call
See which screens and calls slow the experience
Crashes ranked by users affected
Know whether an issue is widespread or isolated
Review real sessions with their device and location
Less switching between separate tools
Share one trace across front-end and backend teams
FAQ

Flutter Web monitoring, answered.

What is Flutter Web monitoring?
Flutter Web monitoring shows how a Flutter application behaves for real users in the browser — crashes, screen performance, network calls and sessions — and connects that experience to the backend services and databases behind each request.
What can Applicare show for a Flutter Web application?
Applicare brings together application health and crashes, screen performance, network activity, real-time transactions, user sessions, and device and location breakdowns for the application, in one view.
Can I trace a slow request from the browser to the backend?
Yes. Open a call in the Network view and Applicare follows it from the end user and Flutter application through the browser and network, then through application services and databases, with timing at every step so you can see where the time is actually spent.
Does Applicare show individual SQL statements?
Yes. In a transaction trace, the database tier expands to list each SQL statement with its own timing.
Can I see which users and devices are affected?
Yes. The Devices view breaks sessions down by country, browser, device and operating system, and shows crash-free sessions by version, so you can tell whether an issue is widespread or isolated to one segment. The Sessions view lets you open an individual session’s timeline.
Are the screenshots on this page from a real customer?
No. They come from an Applicare walkthrough using a demo application (“Demo Shop”) with sample data. They show the product interface, not customer results.
How does ArcIn AI relate to Flutter Web monitoring?
ArcIn is Applicare’s AI layer for the platform. It works from the same telemetry Applicare collects across your stack to help correlate signals and point toward likely causes. Talk to us about how it applies to your Flutter applications.
How do I get started?
Request a demo and our team will walk through Flutter Web monitoring with you, or watch the full walkthrough on this page first.
See your Flutter Web experience with Applicare.

Understand health, crashes, screens and network activity — and trace any transaction from the browser to the backend.